2026 Market Size and Growth Trajectory
The global water treatment chemicals market is projected to reach USD 71–74 billion by 2026, growing at a 6.0–6.8% CAGR from the 2022 baseline of USD 56.57 billion published in the 2017→2022 forecast (PRNewswire, 2017-09). Extrapolating that trajectory year by year yields roughly USD 60B in 2023, USD 64B in 2024, USD 68B in 2025, and USD 71–74B in 2026 — a defensible band that any procurement team can anchor a 2026 budget model to. The 2019→2026 produced-water forecast published in late 2020 (GlobeNewswire, 2020-11) already used 2026 as a reference horizon, which is itself a signal that industry analysts were building 2026 — not 2030 — into contract and capex planning cycles. That makes 2026 the practical planning year for plant engineering managers, not a distant target.
Regional growth is uneven. Asia-Pacific runs at 7.5–8% CAGR, driven by Chinese discharge-standard updates, Indian ZLD adoption, and Southeast Asian electronics capacity buildout. North America and Europe track 5–6% CAGR — slower volume, but higher specialty-chemical intensity per m³ because of PFAS, ZLD, and ultrapure-water requirements. The procurement implication is straightforward: commodity coagulants and flocculants will be priced on global Asian supply, while specialty oxidants, antiscalants, and PFAS-targeted chemistries will be priced on regional regulatory pull. Buyers who treat these as one market will mis-budget by 10–15%.
Segmentation by Chemical Type: Where the Growth Is
Coagulants and flocculants remain the largest segment, holding roughly 35–40% of global spend and growing at 5.5–6% CAGR. The workhorses — polyaluminum chloride (PAC), ferric chloride, and polyacrylamide (PAM, both cationic and anionic) — anchor municipal and industrial clarification, and their growth tracks raw-water throughput plus tightening solids capture targets. Scale and corrosion inhibitors, at about 20% share, are growing faster at 6–7% CAGR because every new RO unit, cooling-tower upgrade, and ZLD loop pulls in additional antiscalant and dispersant demand. pH adjusters and broader specialty chemicals make up roughly 25% of the market at 5–6% CAGR.
The fastest-growing segment is biocides and disinfectants at 7.5–9% CAGR, driven by Legionella control in building water systems, cooling-tower microbiological compliance, and the shift from bulk chlorine to on-site generation. Chlorine dioxide is the headline chemistry here: it operates effectively across a pH 4–10 window, controls biofilm where hypochlorite struggles, and generates no halogenated disinfection byproducts at typical 0.2–1.0 mg/L doses. Scaling an on-site ClO2 generator from 50 g/h laboratory units to 20,000 g/h industrial skids (HydropureWater product catalog, 2026) lets a plant replace bulk biocide deliveries with on-demand generation, removing hazardous-transport risk and stabilizing unit cost per m³.
| Chemical Type | Approx. 2026 Share | 2022→2026 CAGR | Primary Industrial Applications |
|---|---|---|---|
| Coagulants & flocculants (PAC, FeCl₃, PAM) | 35–40% | 5.5–6% | Raw water, industrial wastewater, DAF feed |
| Scale & corrosion inhibitors | ~20% | 6–7% | Cooling towers, RO pretreatment, boilers |
| pH adjusters & specialty | ~25% | 5–6% | ZLD, heavy-metal precipitation, reuse |
| Biocides & disinfectants (ClO₂, O₃, hypochlorite) | ~15% | 7.5–9% | Cooling, Legionella, reuse, PFAS oxidation |
End-User Demand: Industrial Buyers Drive 60%+ of Spend
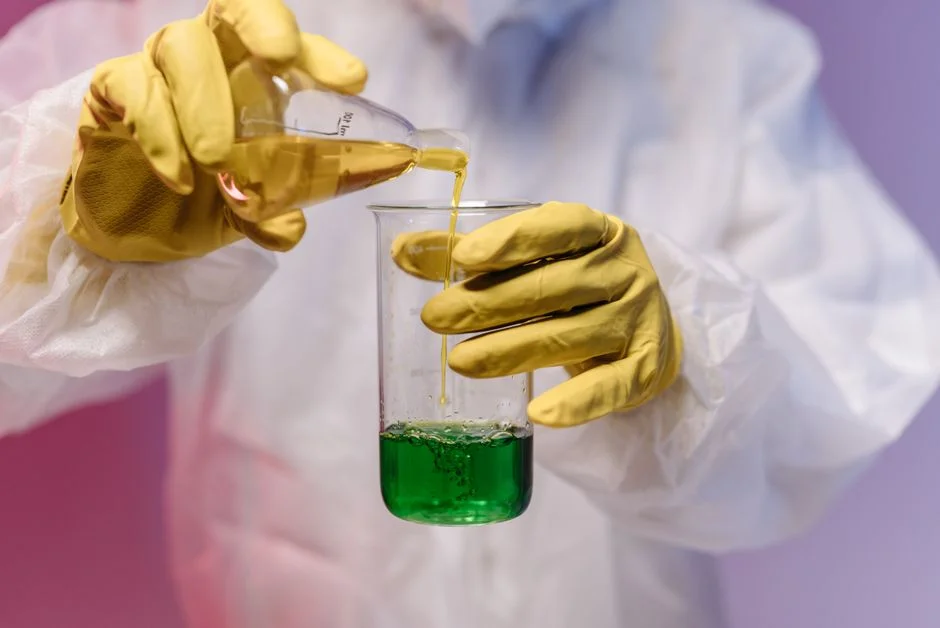
Industrial end users — power generation, food and beverage, pharma, pulp and paper, metal finishing, and semiconductors — account for roughly 60% of global water-treatment-chemical spend and are growing at 6.5–8% CAGR. Municipal water and wastewater utilities make up about 35% of demand at a more modest 4–5% CAGR, constrained by public budget cycles and slower regulatory turnover. Oil and gas, including produced-water treatment, remains a niche but high-value segment; the 2019→2026 produced-water forecast (GlobeNewswire, 2020-11) modeled mid-single-digit growth on the back of reuse mandates in Permian, Middle Eastern, and Chinese fields.
The fastest-moving sub-segment inside industrial is semiconductor and green-hydrogen at 10–12% CAGR, driven by ultrapure-water (UPW) demand for wafer fabrication and electrolyzer cooling. UPW specs — typically 18.2 MΩ·cm resistivity, TOC below 1 ppb, and silica below 0.5 ppb — push chemical programs toward high-purity regenerants, mixed-bed resins, and sub-ppb analytical monitoring, a regime where chemical grade and consistency matter more than bulk price. This is the segment where water reuse market drivers 2026 intersect directly with chemistry selection, because every reused m³ in a fab or hydrogen plant carries a tighter spec than the equivalent municipal reuse stream.
Regulatory and Technology Drivers Shaping 2026 Demand
Four regulatory and technology drivers are reshaping 2026 chemical demand. First, the EPA PFAS Maximum Contaminant Level rules finalized in 2024 are accelerating consumption of granular activated carbon, ion exchange resins, and oxidant chemistries used upstream of those media to break C–F bonds or destroy PFAS precursors — see PFAS removal market drivers 2026 for the technology split. Second, the EU Industrial Emissions Directive 2010/75/EU and the revised Urban Wastewater Treatment Directive are pushing advanced nutrient removal, with a real trade-off for plant engineers: intensified biological treatment cuts chemical demand but raises energy and footprint, while chemical precipitation (Mg(OH)₂, FeCl₃ for phosphorus) keeps capex low but lifts OPEX per m³. Third, China's GB 25466 and GB 18918 updates are tightening heavy-metal and total-nitrogen limits, which lifts coagulant and polymer consumption per m³ across Chinese heavy industry.
Fourth, Zero Liquid Discharge mandates in India, China, and the US Southwest are accelerating antiscalant, cleaning-chemical, and pH-adjuster consumption in crystallizer and brine-concentrator loops. A typical thermal ZLD system burns through 0.5–2.0 kg of antiscalant per m³ of recovered water, roughly 3–5× the dose of a conventional RO reject stream. Layered on top of regulation, on-site generation of ClO₂ and ozone is a 2026 trend growing 8–10% annually because it stabilizes cost per m³, removes hazardous-transport risk, and aligns with corporate Scope 1 emissions reporting by cutting truck-miles for bulk chemicals. Membrane bioreactor market growth 2026 reinforces the same direction: as MBR capacity replaces conventional activated sludge, chemical demand for clarification drops but polishing-stage chemical demand (antiscalant, residual oxidant quenching) rises.
Chemical Type × Application: Where to Spend Your 2026 Budget
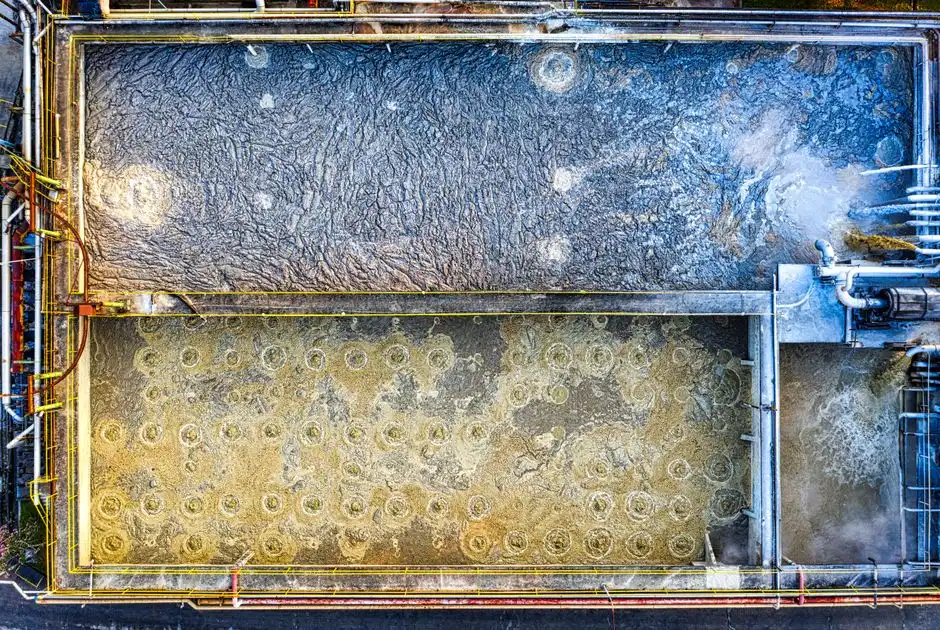
The decision matrix below maps chemical type against the most common plant applications, with 2026 growth rate and indicative dose range so a procurement manager can identify where their own plant sits in the growth curve. Dose ranges are engineering typicals drawn from municipal and industrial practice, not vendor-specific marketing claims.
| Chemical Type | Raw Water | Cooling Tower | Boiler Feed | Industrial Wastewater | Reuse / ZLD |
|---|---|---|---|---|---|
| Coagulant (PAC, FeCl₃) | 5–50 mg/L, 5.5–6% CAGR | Not typical | Not typical | 20–150 mg/L, 5.5–6% CAGR | 5–20 mg/L (polishing), 5.5–6% CAGR |
| Flocculant (PAM) | 0.1–2 mg/L, 5.5–6% CAGR | Not typical | Not typical | 0.5–5 mg/L, 5.5–6% CAGR | 0.2–1 mg/L, 5.5–6% CAGR |
| Biocide / disinfectant (ClO₂, O₃, hypochlorite) | 0.2–1.0 mg/L ClO₂, 7.5–9% CAGR | 0.5–3 mg/L (oxidizing), 7.5–9% CAGR | 0.2–0.5 mg/L, 7.5–9% CAGR | 1–5 mg/L (intermittent shock), 7.5–9% CAGR | 0.5–2 mg/L, 7.5–9% CAGR |
| Scale & corrosion inhibitor | 0.5–2 mg/L, 6–7% CAGR | 5–30 mg/L (program-dependent), 6–7% CAGR | 2–10 mg/L, 6–7% CAGR | 1–5 mg/L (RO feed), 6–7% CAGR | 0.5–2 kg/m³ antiscalant (thermal ZLD), 6–7% CAGR |
| pH adjuster / specialty | NaOH / H₂SO₄ as needed, 5–6% CAGR | NaOH / H₂SO₄ for cycles, 5–6% CAGR | NaOH / ammonia, 5–6% CAGR | NaOH / lime for metal precipitation, 5–6% CAGR | NaOH / HCl for brine pH control, 5–6% CAGR |
Specialty chemicals are rising 4–6% annually; bulk commodity coagulants are tracking 2–3%, so any 2026 budget model should split the inflation line. Plants that want to lower total chemical loading by 20–30% should pair chemistry selection with pretreatment upgrades — a DAF pretreatment system ahead of biological or membrane stages, or a lamella clarifier for high-solids raw water — so coagulant dose drops and downstream membrane or MBR loading falls with it.
B2B Procurement Implications for 2026
Five procurement actions follow directly from the 2026 market data. First, shift from bulk biocide delivery to on-site generation where throughput justifies the capex: a plant consuming 200+ kg/month of ClO₂ or ozone typically sees 5–15% OPEX savings, eliminates hazmat-transport paperwork, and stabilizes unit cost against the 4–6% annual rise in bulk specialty pricing. Second, upgrade dosing systems to PLC-controlled automatic skids — a PLC-controlled automatic chemical dosing skid cuts overdosing by 10–25% versus progressive-cavity pumps with manual setpoints and gives operators a defensible compliance log. Third, lock multi-year supply contracts for coagulants and flocculants, which are commodity-priced and freight-sensitive; spot procurement is acceptable for specialty oxidants and antiscalants where the supplier list is shorter but the price moves with regulation, not freight.
Fourth, treat the 2026–2028 regulatory window as a chemical-reformulation cycle, not a one-off price event: PFAS MCL compliance, EU UWWTD nutrient rules, and Chinese GB updates will each trigger a 6–18 month period of price volatility in the affected chemistries. Fifth, pair any chemical-program redesign with pretreatment upgrades — DAF, lamella clarifier, or multi-media filter — to reduce total chemical loading 20–30% and to convert chemical OPEX into a more stable, equipment-driven cost line. Plants that execute all five actions typically hold 2026 chemical OPEX flat against 2024 baselines even as specialty pricing rises 4–6% annually.
Frequently Asked Questions
How large is the water treatment chemicals market in 2026? The market is projected at USD 71–74 billion in 2026, extrapolated from the USD 56.57 billion 2022 baseline (PRNewswire, 2017-09) at 6.0–6.8% CAGR.
Which chemical segment is growing fastest in 2026? Specialty biocides and PFAS-targeted oxidants are growing at 7.5–9% CAGR, the fastest of any major segment, driven by Legionella control, reuse, and PFAS compliance.
What is the typical chemical cost per cubic meter in 2026? Total treatment chemical cost typically runs USD 0.02–0.15 per m³ depending on segment — industrial wastewater and ZLD sit at the upper end, municipal raw water at the lower end — with a 4–6% annual upward trend on specialty chemistries and 2–3% on bulk coagulants.
Is the industry shifting from bulk chemical delivery to on-site generation? Yes. On-site ClO₂ and ozone generation is growing 8–10% annually as plants replace bulk deliveries to cut hazmat transport, stabilize unit cost, and improve Scope 1 emissions reporting.
Which region is growing fastest? Asia-Pacific leads at 7.5–8% CAGR, followed by North America and Europe at 5–6% CAGR, with the Americas carrying higher specialty-chemical intensity per m³ because of PFAS and ZLD drivers.