Why Textile Wastewater Plants Need Remote Monitoring in 2026
A single reactive-dyeing batch can push equalization-basin TDS from 8,000 to 60,000 mg/L and COD to 4,000 mg/L inside 30 minutes, a shock load that crashes an MBR before any operator smells the problem and that a once-daily lab grab sample cannot catch. Textile effluent is uniquely unforgiving because batch discharge is intermittent, recipes swing hourly between reactive, disperse, and acid-dye chemistries, and hot rinse water (40–60 °C) strips dissolved oxygen the moment it enters the aeration basin. A 2024 BEEI study on textile IoT monitoring (Bulletin of Electrical Engineering and Informatics, Vol. 13, No. 5) validated that a 5-sensor stack — pH, ORP, TDS, temperature, color — achieves 98.68%, 98.6%, 98.98%, 99.78% accuracy on textile wastewater respectively, with roughly 2 seconds of client-server delay, which is the academic anchor every 2026 CAPEX request needs. Textile ETPs typically run 24/7 on skeleton shifts, and aeration basins, equalization tanks, and MBR tanks are often 200–500 m from the control room, so a local siren is functionally inaudible. The remainder of this guide covers the scope, four-tier architecture, 11-parameter KPI matrix, regulator mapping across China, India, Bangladesh, and the EU, three plant-size cost bands, and a 90-day rollout plan you can hand to procurement.
What a Remote Monitoring System for a Textile ETP Actually Is
A remote monitoring system for a textile wastewater plant is a four-tier stack that turns batch-process chemistry into regulator-ready data: field instrumentation, an edge controller, a network layer, and an application layer. The field tier carries IP68 industrial pH, ORP, conductivity/TDS, dissolved oxygen, temperature, TSS, color (RGB or UV254), and sulfide probes plus electromagnetic flow meters on sewage lines at influent, equalization, and final effluent. The edge tier is a PLC or RTU — Siemens S7-1500, Allen-Bradley CompactLogix, or Schneider M340 — sampling at 1–10 seconds, buffering locally on power loss, and publishing over Modbus TCP or OPC-UA. The network tier is 4G/5G cellular for mills off the corporate WAN, LoRaWAN for in-plant wireless probes, and a hardened on-prem gateway where SCADA traffic cannot leave the site. The application tier is a cloud historian (AWS IoT, Azure Industrial IoT, or on-prem Ignition), a web HMI, an SMS/email alarm engine, and an API into the mill's compliance reporting module. The TimberGrove remote-water case study (2024) is the proven reference pattern: 15-minute dashboard refresh, sub-30-second SMS/email on alarm events, and a 4–6 week integration into existing OT infrastructure.
| Tier | Typical Components | Sample / Publish Rate | 2026 Cost Share |
|---|---|---|---|
| Field | pH, ORP, TDS, DO, TSS, color, sulfide, flow | Continuous (1 s sensor response) | 25–35% of CAPEX |
| Edge | PLC / RTU, I/O cards, panel, UPS | 1–10 s scan, 1–5 min publish | 20–25% of CAPEX |
| Network | 4G/5G cellular, LoRaWAN gateway, firewall | Event-driven, 60 s heartbeat | 5–10% of CAPEX |
| Application | Cloud historian, SCADA, dashboard, alarm engine | 15 min refresh, <30 s alarm push | 25–30% of CAPEX |
Textile-Specific KPIs the Dashboard Must Track
The BEEI paper covers five probes; a 2026 textile deployment needs eleven, because reactive-dye hypersalinity and dyebath pH excursions are precisely what the academic 5-sensor stack cannot flag. Every KPI below should specify measurement range, sensor type, target band, and alarm threshold — this is the row a buyer pastes into the URS.
| Location | Parameter | Range | Sensor Type | Target / Alarm | Typical Accuracy |
|---|---|---|---|---|---|
| Influent | Flow | 0–500 m³/h | Electromagnetic flow meter | Totalized daily; surge >1.3× baseline | ±0.5% |
| Influent | pH | 0–14 | Glass-body, double junction | 6–9; alarm <5 or >11 | ±0.1 pH (98.68% per BEEI 2024) |
| Influent | COD | 0–5,000 mg/L | UV254 + turbidity proxy | 500–4,000; alarm >4,000 | ±5% FS (HydropureWater field data, 2026) |
| Influent | BOD | 0–2,000 mg/L | Lab-correlated UV254 | 200–1,500; alarm >1,500 | ±10% FS, weekly lab check |
| Influent | Color | 0–500 Pt-Co | RGB or UV254 optical | Alarm >300 Pt-Co | ±2% FS |
| Influent | Temperature | 0–100 °C | PT1000 | 40–60 °C; alarm >65 | ±0.2 °C (99.78% per BEEI 2024) |
| Influent | TDS / Salinity | 0–60,000 mg/L | 4-electrode conductivity | 5,000–60,000; alarm >50,000 | ±1% FS (98.98% per BEEI 2024) |
| Equalization | ORP | −2,000 to +2,000 mV | Platinum-ring probe | −200 to +400 mV | ±5 mV (98.6% per BEEI 2024) |
| Aeration | DO | 0–20 mg/L | Optical luminescent | 1.5–2.5 mg/L setpoint | ±0.1 mg/L |
| Aeration | MLSS / TSS | 0–10,000 mg/L | Optical IR scatter | 3,000–5,000 mg/L; alarm >6,000 | ±3% FS |
| MBR / DAF outlet | TSS / Turbidity | 0–100 NTU | Self-cleaning optical | <10 mg/L target | ±2% FS |
| Final effluent | Residual chlorine | 0–10 mg/L | Amperometric | 0.2–1.0 mg/L for reuse | ±0.05 mg/L |
| Anaerobic zone | Sulfide | 0–500 mg/L | ISE / ion-selective | <50 mg/L; corrosion alarm >100 | ±5% FS |
DO on the aeration basin is the single most expensive parameter to monitor and the one with the largest energy payback — see the aeration energy cost optimization reference for the 8–15% blower-VFD saving a tight DO loop delivers. Solids control on the MBR side uses the same optical TSS principle covered in the suspended solids removal guide, which is why a single self-cleaning probe often serves both MBR and DAF outlet points.
System Architecture: From Sensor to Compliance Log
The data path is a horizontal flow across five boxes: probe → 4–20 mA or Modbus RTU signal → edge PLC scanned at 100 ms and buffered locally → on-prem or cloud gateway publishing every 1–5 minutes → historian → SCADA/HMI plus cloud dashboard plus SMS/email engine. The end-to-end latency budget is 1 s at the sensor, 100 ms at the PLC scan, 60 s at the gateway publish, 15 minutes at the dashboard refresh (per the TimberGrove case), and under 30 s for event-driven alarm push — a budget every integrator should be asked to commit to in writing. Cybersecurity follows IEC 62443: isolate the OT network with a unidirectional gateway or DMZ, terminate cellular on a private APN or IPsec VPN, disable USB on engineering stations, and sign PLC firmware. Existing assets — MBR PLCs, DAF skimmer, chemical dosing skids, blower VFDs — should expose a documented Modbus register map that the gateway polls; a missing register map is the single most common cause of week-12 integration overruns. Raw data retention of 5 years plus 1 year of 1-minute aggregates is the regulator-defensible default, and cloud storage in 2026 runs $0.02–$0.05/GB-month, which means a 5-year raw archive for a 1,000 m³/day mill lands at roughly $400–$1,000/yr. A digital twin for industrial wastewater plant deployment consumes the same historian feed and is the natural Phase 2 once the SCADA layer is stable.
Aligning Monitoring Scope with Textile Discharge Regulations

The KPI list above is not arbitrary — every parameter maps to a discharge limit a regulator can fine a mill for, which is why a remote system is the only practical way to produce a defensible compliance audit trail in 2026. The same data that drives an alarm generates the monthly self-monitoring report, and automated compliance reporting for wastewater cuts the labor cost of that report by roughly 40%.
| Regulator / Standard | Discharge Scope | Key Limits | Monitoring Implication |
|---|---|---|---|
| China GB 4287-2012 (textile dyeing & finishing) | Direct discharge to municipal sewer or surface water | COD 80 mg/L, BOD 20 mg/L, color 40 dilution, pH 6–9, NH₃-N 10 mg/L, SS 50 mg/L | Continuous COD, BOD proxy, pH, color logging; daily composite sampler for NH₃-N |
| Bangladesh DOE Schedule-10 (textile ETP, knit vs woven split) | Inland surface water | COD 200 mg/L, BOD 50 mg/L, TSS 60 mg/L, pH 6–9; TDS no specific, referenced for ZLD | Continuous TSS, pH, COD, and conductivity logging; TDS for evaporation pond mass balance |
| India CPCB ZLD (Tirupur, Ludhiana clusters) | Zero liquid discharge to land | No liquid effluent; TDS, conductivity, recovery-loop volumes fully logged | Continuous TDS, conductivity, RO recovery ratio; daily water mass balance; condensate conductivity |
| EU BAT-AEL (BAT 14, BREF Textiles 2023 release) | Direct discharge to receiving water | COD 50–160 mg/L tiered; color visible absence; AOX monitoring for wool and polyester | Continuous COD, color, AOX; tiered alarm thresholds based on flow and recipient |
2026 Cost Benchmarks for Remote Monitoring Retrofits
Three plant-size bands anchor a 2026 CAPEX request without needing vendor proposals yet. Numbers are mid-2026 USD-equivalent CAPEX plus OPEX, derived from HydropureWater field data and recent India/Bangladesh project bids.
| Plant Size | Daily Flow | Hardware CAPEX | Install CAPEX | Subscription OPEX | Rollout |
|---|---|---|---|---|---|
| Small mill, single line | 50–200 m³/day | $35,000–$80,000 | $10,000–$20,000 | $8,000–$20,000/yr | 6–8 weeks |
| Mid-tier integrated mill, multi-line | 500–1,000 m³/day | $120,000–$220,000 | $30,000–$60,000 | $20,000–$40,000/yr | 8–12 weeks |
| Large ZLD-bound mill | 2,000–5,000 m³/day | $180,000–$400,000 | $50,000–$100,000 | $40,000–$80,000/yr | 12–16 weeks, often bundled with digital twin |
Across all three bands, 25–35% of CAPEX sits in field instrumentation, 20–25% in PLC/RTU and panel, 25–30% in software/dashboard/cloud, and 10–15% in install, commissioning, and training. The ROI case has three hooks: avoiding one off-spec discharge event ($25,000–$100,000 in fines plus shut days), removing two operator shifts ($60,000/yr in labor), and trimming aeration energy 8–15% via tighter DO control on the MBBR/activated-sludge loop.
Supplier Selection Checklist and 90-Day Rollout Plan
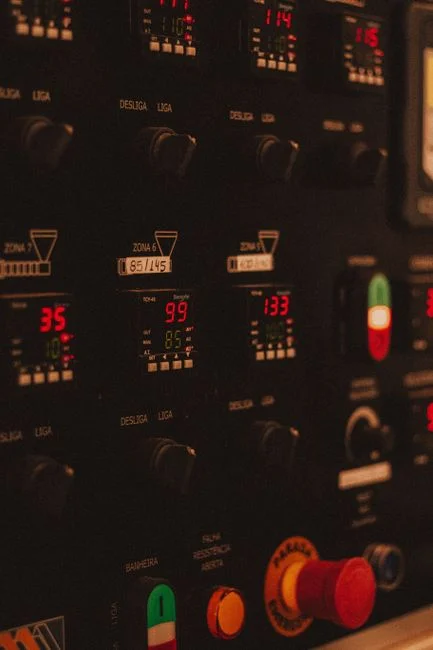
The checklist below is the minimum a textile buyer should demand from any vendor before signing a PO; the rollout is the schedule to hand to a project manager on day one.
| Phase | Weeks | Activities | Deliverable |
|---|---|---|---|
| Site survey & URS | 1–2 | Influent/effluent characterization, panel-location walkdown, register map request to MBR/DAF/dosing vendors | Signed URS, P&ID markups |
| Procurement & build | 3–6 | PLC panel assembly, probe delivery, cloud tenant provisioning, FAT at vendor shop | FAT report, shipped panels |
| Install & loop checks | 7–10 | Probe insertion, cable glanding, signal loop checks, parallel cabinet hot-cutover | Loop-check sheets, as-built drawings |
| SCADA & alarm tuning | 11–12 | Dashboard build, alarm-threshold tuning against 1-week live data, operator training | Live dashboard, alarm matrix |
| SAT & handover | 13–14 | Site acceptance test against URS, cybersecurity review, O&M manuals handed over | SAT certificate, O&M manuals |
| Optimization | 15–16 | Trend review, alarm rationalization, DO setpoint retune, energy baseline report | Optimization report, ROI baseline |
Vendor screening: proven textile references, IEC 62443 cyber certification, Modbus/OPC-UA openness, regional service within 48 hours, 24/7 alarm support SLA, multi-tenant cloud plus on-prem option, and a data-ownership clause that keeps raw data on the mill's historian. Hardware screening: IP68 probes for wet zones, self-cleaning optical sensors for color and TSS, redundant DO probes on the aeration basin, surge protection on every signal line, and UPS on both PLC and gateway. The mill's existing MBR membrane bioreactor, DAF system, and automatic chemical dosing system should ship with documented Modbus maps; the difference between a 4-week integration and a 14-week integration is almost always whether those register maps exist. Common pitfalls: undersizing the gateway, ignoring cybersecurity until SAT, skipping the FAT, and choosing a vendor that cannot reach the site inside 48 hours. If your textile ETP is not on a remote monitoring platform in 2026, you are running blind to batch shocks, paying for compliance labor you could automate, and one event away from a regulator shutdown.
Frequently Asked Questions
What sensors are mandatory for a textile wastewater remote monitoring system? pH, ORP, TDS, COD, BOD, color, dissolved oxygen, flow, temperature, and TSS — ten parameters that together cover reactive-dye hypersalinity shocks, dyebath pH excursions, color spikes that defeat downstream RO, sulfide corrosion in anaerobic zones, and aeration energy waste; a sulfide probe is the eleventh parameter worth adding for any anaerobic or high-sulfate feed.
How much does a remote monitoring system cost for a textile plant in 2026? Hardware CAPEX runs $35,000–$80,000 for a small 50–200 m³/day mill, $120,000–$220,000 for a 500–1,000 m³/day integrated mill, and $180,000–$400,000 for a 2,000–5,000 m³/day ZLD-bound mill, with cloud and SCADA subscription OPEX of $8,000–$80,000/yr depending on size.
Can an existing textile ETP be retrofitted with remote monitoring without shutting down the plant? Yes — bypass loops on flow lines, parallel mounting of new analyzer panels, and phased loop-by-loop commissioning keep the ETP online; full plant shutdown is not required for any of the three plant-size bands.
How does remote monitoring help with ZLD compliance for textile wastewater? Continuous TDS, conductivity, and recovery-loop visibility gives the mill a regulator-defensible daily mass balance across RO, MEE, and crystallization, and the same data generates the daily log the Indian CPCB Tirupur and Ludhiana ZLD orders require.
How fast can a textile plant go live with a remote monitoring system? 6–8 weeks for a small single-line mill, 8–12 weeks for a mid-tier integrated mill, and 12–16 weeks for a large ZLD-bound mill — the same weeks-not-months pattern documented in the TimberGrove tubing-mill case study.