Why MBR Is Now the Default for Recirculating Aquaculture Wastewater
MBR has displaced conventional clarification-plus-biofilter trains in most new land-based RAS projects above 20 m³/day because it solves the two failure modes that kill fish and inflate operating cost simultaneously: ammonia spikes and suspended-solid breakthrough. Raw aquaculture effluent typically carries COD 250–800 mg/L, TSS 80–400 mg/L, total ammonia nitrogen (TAN) 5–40 mg/L, and pH 6.5–8.5 (per the aquaculture wastewater characterization dataset in the Toplo remediation study, 2020-11). A submerged flat-sheet MBR delivers a single step that nitrifies TAN to <1 mg/L NH₃-N and produces a clarified permeate with TSS <5 mg/L and turbidity <1 NTU — well below the threshold at which particle shielding degrades UV/ozone disinfection of fish pathogens such as Aeromonas and Vibrio.
The case is no longer theoretical. A 6 m² submerged PES UF pilot MBR in Kisumu, Kenya, coupled to a RAS, sustained 90–95% water recirculation and produced effluent in basic agreement with FAO irrigation and aquaculture guidelines, with no adverse effects on tilapia fingerlings (Springer pilot study, 2022). The honest trade-off: MBR CAPEX runs higher than MBBR or constructed-wetland options, but the MBR footprint is 50–70% smaller than a conventional activated-sludge train with a separate clarifier — a decisive advantage on coastal aquaculture sites where land prices commonly exceed $50/m². For most procurement engineers evaluating a new RAS in 2026, MBR is now the reference benchmark rather than the premium option.
Engineering Parameters: How to Size an MBR for an Aquaculture Plant
Aquaculture MBR sizing is driven by TAN load first, hydraulic flow second. The parameter envelope below applies to submerged PVDF flat-sheet MBR at 0.1 μm nominal pore size, the configuration dominating RAS installations in 2026.
| Parameter | Design range | Basis |
|---|---|---|
| HRT (hydraulic residence time) | 4–8 h | COD/TAN loading |
| SRT (sludge retention time) | 30–60 days | Nitrifier retention |
| MLSS | 8,000–12,000 mg/L | Flat-sheet tolerance |
| Design flux | 12–18 LMH | PVDF flat-sheet, 0.1 μm |
| Membrane area per module | 80–225 m² | DF series modules |
| Permeate per module | 32–135 m³/day | At 15 LMH, 24 h operation |
| Process air demand | 0.3–0.6 Nm³/m³ permeate | Biological O₂ transfer |
| Scour air demand | 0.15–0.25 Nm³/m³ permeate | Membrane surface shear |
| Total blower power | 0.25–0.45 kWh/m³ | Combined aeration |
Worked TAN-driven example. A 100 m³/day tilapia RAS discharging 25 mg/L TAN requires the MBR to nitrify roughly 2.5 kg TAN/day. At 15 LMH design flux and 24-hour operation, a 120 m² submerged flat-sheet array produces ~43 m³/day per train — so two parallel trains of 80 m² modules handle the 100 m³/day hydraulic load while providing 1.5× the membrane area needed for the nitrification duty. Effluent TAN drops below 1 mg/L NH₃-N, which is the protective threshold for warm-water tilapia and shrimp (FAO effluent standard).
Two design constraints often missed at the proposal stage: a drum filter or rotary screen rated ≤500 μm must sit upstream to strip fish feces and feed fines before they reach the membrane, and the bioreactor tank should be sized for peak feeding events (TAN can triple within 2 hours of a feed cycle). Map your m²/day requirement to a specific module configuration using the PVDF flat-sheet MBR membrane module sizing data, and pair it with a rotary drum screen for MBR feed protection at the head of the train.
CAPEX Breakdown: What an MBR for Aquaculture Actually Costs in 2026
Aquaculture MBR CAPEX in 2026 benchmarks at $180–$420 per m³/day of installed capacity for plants in the 20–500 m³/day range; sub-20 m³/day skid systems trend to $450–$700/m³/day because automation, controls, and freight are amortized over too few liters. Public municipal cost-trends data shows large 1-MGD MBR plants at $218–$302 per 1-MGD, equivalent to roughly $58–$80 per m³/day at municipal scale (cost-trends PDF, 2024). Aquaculture installations run 2.5–5× higher because of the feed-screen pretreatment train, tighter reuse-quality effluent targets, and smaller average plant size.
| CAPEX line item | % of total CAPEX | Notes |
|---|---|---|
| PVDF membrane modules (flat-sheet cassettes) | 25–35% | DF series, 5–8 year service life |
| Bioreactor tank + blowers + process air piping | 18–22% | FRP or coated carbon steel |
| Feed/drum screen + transfer pumps + pipework | 10–15% | ≤500 μm screening mandatory |
| CIP chemical dosing system | 5–8% | NaOCl + citric acid, automated |
| PLC, instrumentation, control panel | 8–12% | Level, DO, pH, pressure transducers |
| Installation, civil works, freight, commissioning | 18–25% | Site-dependent, higher in remote coastal sites |
Worked sizing cases. A 50 m³/day RAS (small commercial farm) typically lands at $14,000–$22,000 total CAPEX, while a 200 m³/day farm (mid-scale tilapia or shrimp facility) lands at $42,000–$72,000 — about $210–$360 per m³/day installed, which sits comfortably in the mid-band of the $180–$420/m³/day benchmark. For a packaged baseline that bundles the modules, tank, blowers, and controls into a single skid, see the integrated MBR system for aquaculture RAS.
OPEX Breakdown: Energy, Chemicals, Membranes, Labor
Aquaculture MBR OPEX benchmarks at $0.10–$0.35 per m³ treated in 2026, with blower electricity the dominant line item. The split is consistent enough across the 50–500 m³/day band that a procurement engineer can use the table below to model operating cost before vendor engagement.
| OPEX line item | % of total OPEX | Quantified basis |
|---|---|---|
| Aeration / blowers | 50–58% | 0.25–0.45 kWh/m³ at $0.08/kWh = $0.020–$0.036/m³ |
| CIP chemicals (NaOCl + citric acid) | 12–18% | In-situ clean every 2–4 weeks |
| Membrane replacement reserve | 12–15% | PVDF flat-sheet, 5–8 year service life |
| Labor (operator, 0.25–0.5 FTE) | 8–12% | Daily checks, weekly sampling |
| Sludge handling / disposal | 5–8% | Wasted sludge, 0.15–0.25 kg TSS removed/m³ |
At $0.08/kWh, a 100 m³/day plant consumes roughly 9,000–16,000 kWh/year — about $720–$1,300 in blower power alone. The three highest-leverage reductions, in order of payback speed: (1) variable-frequency drives on blowers cut aeration energy 20–30% by matching dissolved oxygen to actual TAN load; (2) a disciplined in-situ CIP every 2–4 weeks with NaOCl (300–500 mg/L) followed by citric acid (1,000–2,000 mg/L) extends membrane life from 5 to 8 years; (3) routing RAS backwash and drum-filter reject to the head of the MBR cuts raw-water intake by 8–12%. For automated CIP control, an automated CIP chemical dosing for MBR skid typically pays back inside 18 months through chemical savings and labor reduction.
MBR vs. MBBR vs. Constructed Wetland vs. DAF + Bio: Cost and Performance Compared
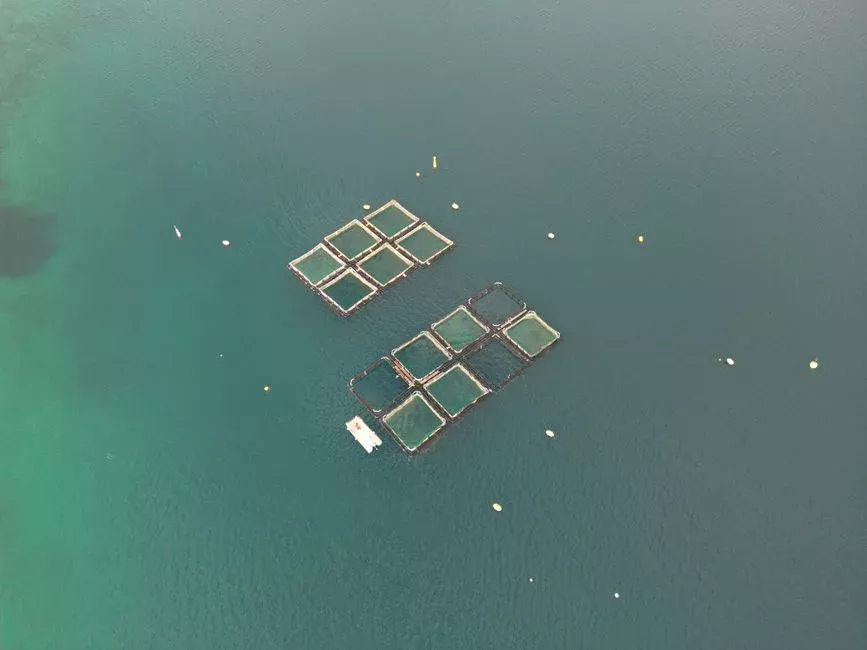
Five treatment trains compete for the aquaculture reuse market. The table below summarizes the trade-offs across CAPEX, OPEX, footprint, effluent reuse quality, and best-fit farm size. Numbers reflect 2026 vendor-quote averages for 100 m³/day installations, warm-climate sites.
| Technology | CAPEX ($/m³/day) | OPEX ($/m³) | Footprint (m²/m³/day) | Reuse-quality effluent | Best-fit farm size |
|---|---|---|---|---|---|
| MBR (submerged PVDF flat-sheet) | 180–420 | 0.10–0.35 | 0.15–0.30 | Yes (TSS <5 mg/L, NH₃-N <1 mg/L) | 20–500 m³/day RAS |
| MBBR (moving-bed biofilm reactor) | 120–260 | 0.08–0.22 | 0.30–0.50 | Partial (TSS 20–40 mg/L, NH₃-N 1–5 mg/L) | >200 m³/day, moderate reuse |
| SBR (sequencing batch reactor) | 140–280 | 0.10–0.25 | 0.35–0.55 | Partial (TSS 10–30 mg/L) | 50–300 m³/day, batch-tolerant species |
| Constructed wetland | 40–110 | 0.03–0.08 | 8–15 | No (variable, season-dependent) | Low-density earthen ponds, large land |
| DAF + trickling filter / biofilter | 90–200 | 0.07–0.18 | 0.40–0.70 | No (TSS 15–30 mg/L) | Flow-through raceways, no reuse |
Decision rule of thumb: MBR wins for RAS with a 90%+ recirculation target on land-constrained sites; MBBR is competitive above 200 m³/day with moderate reuse and a tolerance for downstream solids polishing; constructed wetland has the lowest CAPEX and OPEX but only suits low-density earthen ponds with abundant land and no recirculation requirement. MBR's quantifiable edge is a 60% smaller footprint than conventional activated sludge with separate clarifier, COD <50 mg/L versus 80–120 mg/L for MBBR, and TSS <5 mg/L versus 20–40 mg/L for MBBR — which is the difference between effluent that can be UV-disinfected and reused, and effluent that cannot. For a packaged comparison reference, see the integrated MBR system for aquaculture RAS product page.
Payback and ROI: When the MBR Cost Actually Pays for Itself
The savings stack that justifies MBR CAPEX in aquaculture is straightforward once you translate reuse rate into dollars: avoided feed-water intake ($0.20–$0.50/m³ at most coastal sites), avoided effluent discharge fees ($0.10–$0.30/m³ where permits apply), reduced fish mortality from stable TAN and TSS (1–3% of harvest value, conservatively), and lower biosecurity risk from a controlled reuse loop.
Worked 100 m³/day tilapia RAS case. CAPEX $40,000. OPEX $0.22/m³ × 36,500 m³/year = $8,030/year. Combined water-intake and discharge savings of $0.65/m³ × 36,500 m³/year = $23,725/year. Net annual benefit ≈ $15,700, giving a payback of 2.5 years on the water-cost lever alone. Adding a 2% mortality reduction on a $200,000 annual harvest brings the payback inside 2 years for most tilapia operations. The honest range across the industry is 3.5–6 years for shrimp RAS and sites with cheap intake water, and 2–3 years for tilapia or sea-bass RAS in regions where intake water costs exceed $0.30/m³.
Two risk factors that lengthen payback if ignored: membrane replacement every 5–8 years at $8,000–$15,000 per cycle (build it into the OPEX reserve line from year one), and electricity cost inflation above 4%/year, which erodes the energy-savings argument if blower VFDs are not specified. For a parallel cost benchmark on the membrane step itself, see the UF system cost benchmark for 2026.
Frequently Asked Questions
How much does an MBR cost for a fish farm? Aquaculture MBR CAPEX in 2026 runs $180–$420 per m³/day installed for 20–500 m³/day plants. A 100 m³/day tilapia or shrimp RAS typically lands at $25,000–$55,000 total installed CAPEX, with OPEX of $0.10–$0.35 per m³ treated.
Can MBR-treated wastewater be reused for aquaculture? Yes. The Kisumu Kenya MBR-RAS pilot sustained 90–95% water recirculation with effluent in basic agreement with FAO irrigation and aquaculture guidelines, and no adverse effects on tilapia fingerlings were observed (Springer pilot study, 2022).
How long do MBR membranes last in aquaculture? PVDF flat-sheet modules typically last 5–8 years in aquaculture service when in-situ CIP with NaOCl and citric acid is performed every 2–4 weeks. Skipping CIP drops life to 3–4 years.
Is MBR cheaper than MBBR for aquaculture? It depends on the reuse target. MBBR wins when the OPEX target is below $0.08/m³ and reuse-quality effluent is not required. MBR wins when 90%+ recirculation is the design intent, because MBBR's TSS of 20–40 mg/L cannot be UV-disinfected to aquaculture reuse standard without an added polishing step that erases its CAPEX advantage.
What influent concentrations can an aquaculture MBR handle? A well-sized submerged MBR handles COD up to 2,000 mg/L and TAN up to 60 mg/L with pre-dilution or equalization. For typical RAS loading (COD 250–800 mg/L, TAN 5–40 mg/L), the MBR operates well inside its design envelope. For influent characterization and pre-treatment sizing, see the aquaculture COD and BOD removal engineering guide, or for tropical-region procurement, the MBR supplier selection guide for tropical aquaculture regions.