Why Tanzanian Industrial Buyers Are Upgrading to MBR in 2026
Tanzania's industrial water demand is being reshaped in 2026 by a collision of three forces: factory expansion in Dar es Salaam, Arusha, and Mwanza; tightening discharge enforcement under NEMC's Cap. 191 framework; and a growing number of audit-driven buyers who can no longer pass conventional activated-sludge effluent through a NEMC compliance check. Textile mills in Nyerere Corridor industrial parks, food and beverage plants handling seasonal fruit and dairy waste, tanneries in Moshi, and ethanol distilleries around Dodoma now discharge influent loads that conventional SBR and CAS systems cannot reliably polish to TZS 789:2018 limits. Typical Tanzanian industrial influent ranges sit at textile COD 1,500–5,000 mg/L, food/beverage COD 2,000–8,000 mg/L, and distillery COD 10,000–40,000 mg/L (HydropureWater field data, 2026, cross-referenced with the MBR for distillery wastewater engineering guide). At the same time, the supply market is dominated by trading agents reselling Chinese, Indian, or European skids rather than factory-direct manufacturers — so a defensible selection framework has become a procurement necessity, not a luxury.
MBR vs. Conventional Activated Sludge: Engineering Trade-offs for East African Conditions
An MBR combines a suspended-growth biological reactor with a physical membrane barrier, eliminating the secondary clarifier and tertiary polishing stages that conventional activated sludge (CAS) and SBR systems require. MBR effluent typically exits at TSS <1 mg/L and BOD <5 mg/L in a single step, against CAS effluent at TSS 10–30 mg/L that still demands a polishing stage to meet NEMC ceilings (HydropureWater MBR product specifications, 2026). The biological-side advantage is just as significant: MBR operates at MLSS 8,000–12,000 mg/L versus 2,000–4,000 mg/L in CAS, which cuts aeration tank volume and produces 30–50% less waste activated sludge — a meaningful saving where sludge dewatering logistics in Tanzania are constrained by haulage cost and landfill access. Footprint drops by roughly 60% compared to a CAS system of equal treatment capacity, which is decisive inside the congested industrial plots around Kariakoo and Mikocheni. MBR also decouples HRT from SRT, so a brewery or fruit-processing line that experiences seasonal COD spikes can run without losing biomass or triggering a permit excursion. The trade-off is energy: MBR's permeate pump and aeration demand lift kWh per m³ treated, and membrane cleaning chemicals are an OPEX line CAS does not carry. For most 50–500 m³/day Tanzanian industrial projects, that trade still favours MBR once the avoided tertiary stage, lower sludge disposal cost, and reuse-grade effluent are priced in.
| Parameter | MBR (PVDF) | Conventional Activated Sludge / SBR |
|---|---|---|
| Effluent TSS | <1 mg/L (single step) | 10–30 mg/L (needs tertiary polish) |
| Effluent BOD | <5 mg/L | 10–20 mg/L post-clarifier |
| MLSS operating range | 8,000–12,000 mg/L | 2,000–4,000 mg/L |
| Footprint | ~40% of CAS equivalent | Reference baseline (100%) |
| Waste sludge yield | 30–50% lower | Baseline |
| HRT–SRT coupling | Decoupled (stable under load spikes) | Coupled (sensitive to hydraulic shock) |
| Reuse suitability | Direct RO feed or washwater | Requires sand filter / UF polish |
Buyers comparing an underground integrated sewage treatment system against an integrated MBR membrane bioreactor system for a 100 m³/day plant should size the MBR variant at roughly 0.6× the civil-works footprint and budget the differential CAPEX against avoided tertiary capex and 5-year sludge-disposal savings.
Flat-Sheet vs. Hollow-Fiber MBR: Choosing the Right Membrane Geometry
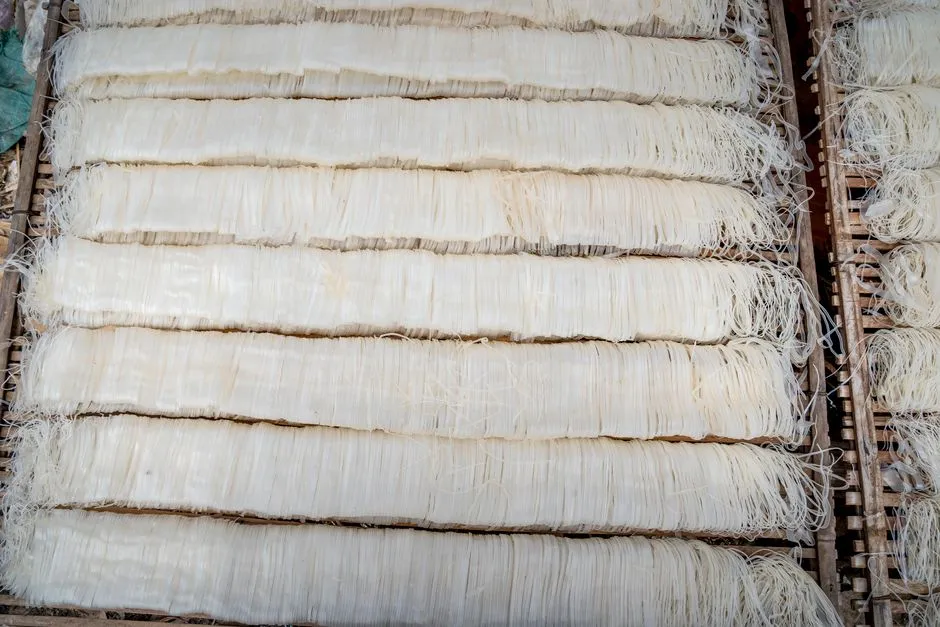
The single most quoted specification in any MBR proposal is the membrane geometry, and the decision maps directly onto influent characteristics. PVDF flat-sheet modules — exemplified by the DF series PVDF flat-sheet membrane module — operate at a nominal pore of 0.1 μm, deliver 80–225 m² of membrane area per stack, and produce 32–135 m³/day per module depending on stack count (HydropureWater DF series datasheet, 2026). The flat geometry tolerates higher mixed-liquor TSS, supports integrated aeration-box scouring that keeps the membrane surface clear, and is mechanically simpler to clean in place — a real operational advantage when dealing with Tanzanian feeds that carry FOG from food processors or fibre from textile mills. Hollow-fiber MBR offers higher packing density and a tighter nominal pore of ~0.03–0.4 μm, but it is more vulnerable to fiber breakage from debris and typically requires a backwash system and pre-filtration to <1 mm. For industrial feeds with high FOG, fibrous content, or particulate loading, flat-sheet is the lower-risk geometry; a DAF pretreatment system ahead of either geometry is standard practice in 2026 East African specifications.
| Parameter | PVDF Flat-Sheet (DF series) | PVDF Hollow-Fiber |
|---|---|---|
| Nominal pore size | 0.1 μm | 0.03–0.4 μm |
| Area per module | 80–225 m² / stack | 25–40 m² per element, multi-element cassettes |
| Typical flux (industrial) | 15–25 L/m²·h | 10–20 L/m²·h |
| TSS tolerance in mixed liquor | Up to 12,000–15,000 mg/L | Up to 8,000–10,000 mg/L |
| Backwash requirement | Relaxation + CIP; no backwash pump | Periodic backwash pump + CIP |
| Failure mode under debris | Tolerant; mechanical robustness | Fiber breakage risk; needs <1 mm pre-screen |
| Cleaning cycle (recovery CIP) | Every 6–12 months | Every 3–6 months |
| Indicative replacement cost (2026) | $25–$55 per m² of membrane area (HydropureWater field data, 2026) | $35–$70 per m² of membrane area |
The replacement-cost row pulls from the MBR membrane replacement cost in 2026 pricing data — useful for amortizing membrane OPEX into a 10-year lifecycle model before the supplier quote arrives.
2026 MBR CAPEX and OPEX Ranges for Tanzanian Industrial Projects
Most supplier pages hide pricing behind an RFQ wall. The 2026 East African benchmark for a 50–500 m³/day industrial MBR system — containerized or skid-mounted, including membranes, blowers, control panel, and factory acceptance test — runs $280–$650 per m³/day installed (FOB), with the lower end applying to standardized containerized plants in the 200–500 m³/day range and the upper end to small 50–100 m³/day bespoke builds or feeds requiring extensive pretreatment (HydropureWater catalog cross-reference, 2026; corroborated by the MBR operating cost in 2026 OPEX breakdown). OPEX lands at $0.18–$0.42 per m³ treated, dominated by aeration energy (blower kWh), membrane cleaning chemicals (citric acid, sodium hypochlorite for CIP), and an amortized membrane-replacement line. Add 8–14% to FOB for landed cost in Dar es Salaam: ocean freight, port clearance, and overland transport to Arusha or Mwanza can each add 2–5% of equipment value. Containerized MBR skids shorten site installation from 8–12 weeks to 3–5 weeks because civil works reduce to a concrete plinth and interconnecting pipework — a 2026 East African procurement trend driven by EPC contractors compressing project schedules.
| Cost line | 50–100 m³/day | 100–300 m³/day | 300–500 m³/day |
|---|---|---|---|
| CAPEX (FOB factory, USD/m³/day) | $450–$650 | $350–$500 | $280–$400 |
| Landed cost adder (Dar es Salaam) | +10–14% | +8–12% | +8–10% |
| OPEX (USD/m³ treated, incl. energy + chemicals + amortized membrane) | $0.28–$0.42 | $0.22–$0.35 | $0.18–$0.28 |
| Membrane replacement amortized (USD/m³) | $0.04–$0.08 | $0.03–$0.06 | $0.02–$0.05 |
| Typical payback vs. trucked-haul disposal | 24–36 months | 18–30 months | 12–24 months |
Meeting NEMC and TZS 789:2018 Discharge Standards with MBR
Tanzania's National Environment Management Council (NEMC) administers industrial discharge under the Environmental Management Act (Cap. 191), with TZS 789:2018 setting the binding effluent ceilings: BOD ≤30 mg/L, COD ≤60 mg/L, TSS ≤30 mg/L, pH 6.5–8.5, plus oil and grease ≤10 mg/L and residual chlorine limits where disinfection is on-site (TZS 789:2018; NEMC compliance guidance). A correctly designed MBR with a 0.1 μm PVDF membrane and an operating flux of 15–25 L/m²·h delivers BOD ≤5 mg/L, COD ≤30 mg/L, and TSS ≤1 mg/L in a single pass — comfortably under the regulatory ceiling and consistently below the limits a NEMC auditor will flag. Where the discharge permit also requires faecal coliform control — hospitals, food processors, abattoirs — pair the MBR with a chlorine dioxide generator sized to deliver 1–2 mg/L residual after a 30-minute contact time. For multi-country operators, the compliance pattern repeats: analogous Central and Southern African regulators apply comparable ceilings (see the hospital wastewater treatment in Luanda engineering guide for the parallel Angolan framework), so a single MBR design package with localized disinfection chemistry is portable across the region.
| Parameter | TZS 789:2018 limit (industrial) | Typical MBR effluent (PVDF, 0.1 μm) | Compliance margin |
|---|---|---|---|
| BOD | ≤30 mg/L | ≤5 mg/L | 6× under limit |
| COD | ≤60 mg/L | ≤30 mg/L | 2× under limit |
| TSS | ≤30 mg/L | ≤1 mg/L | 30× under limit |
| pH | 6.5–8.5 | 6.5–8.5 (post-equalization) | Within band |
| Oil & grease | ≤10 mg/L | ≤2 mg/L (with DAF pretreatment) | 5× under limit |
10-Point Checklist for Selecting an MBR System Supplier in Tanzania
- Confirm factory-direct manufacturing. Request workshop photos, CNC membrane-casting line footage, and an annual capacity certificate. Trading agents cannot show this.
- Validate membrane origin. Branded PVDF (Asahi Kasei, Toray, MEMOS, or in-house like the DF series) versus unbranded white-label stock is a $20–$40/m² lifetime cost difference.
- Require reference projects in East Africa or comparable tropical climates. Ambient temperatures of 25–32 °C shift biological kinetics and fouling rates; cold-climate references are weak evidence.
- Demand documented NEMC / TZS 789 compliance test reports from operating sites. Theoretical specs do not satisfy an auditor; third-party lab reports do.
- Check factory acceptance test (FAT) protocols and containerization suitability. ISO 20-ft or 40-ft skid packaging with shock data for the Dar es Salaam–Kigali corridor is the 2026 norm.
- Confirm 24–48 month membrane warranty and replacement-part supply chain into Dar es Salaam. Membrane modules typically ship in 8–12 weeks; verify the supplier holds buffer stock.
- Verify PLC/SCADA platform and remote monitoring capability. Unmanned or low-staffing sites need VPN-accessible dashboards and SMS alarm forwarding.
- Evaluate installation supervision, commissioning, and operator training included in the contract. A 7–14 day on-site commissioning plus a 3-day operator training package is the 2026 standard.
- Compare landed cost on a $/m³/day basis. FOB + ocean freight + Dar es Salaam duties (currently 0–10% for water-treatment equipment under EAC CET) + overland transport + installation — not ex-works price.
- Confirm after-sales local presence or a regional service partner. Membrane cleaning cycles run every 6–12 months; the supplier or agent must commit to a response window under 72 hours for CIP support.
Run any shortlisted integrated MBR membrane bioreactor system or DF series PVDF flat-sheet membrane module proposal through all ten points before issuing a purchase order.
Frequently Asked Questions
What is the realistic 2026 CAPEX for an industrial MBR system in Tanzania? A 50–500 m³/day industrial MBR plant runs $280–$650 per m³/day FOB in 2026, with landed cost in Dar es Salaam adding 8–14% once ocean freight, port clearance, and overland transport are included (HydropureWater catalog, 2026).
How does MBR effluent compare against NEMC TZS 789:2018 industrial discharge limits? A 0.1 μm PVDF MBR delivers BOD ≤5 mg/L, COD ≤30 mg/L, and TSS ≤1 mg/L — against TZS 789 ceilings of 30 / 60 / 30 mg/L respectively — so the design passes with 2–30× margin depending on parameter.
Flat-sheet or hollow-fiber MBR — which is better for high-FOG or fibrous industrial wastewater? Flat-sheet tolerates higher mixed-liquor TSS, survives debris better, and runs longer between CIP cycles (6–12 months versus 3–6 months), making it the lower-risk geometry for Tanzanian food, beverage, and textile feeds (HydropureWater DF series operating data, 2026).
What does MBR OPEX look like per cubic metre treated in 2026? OPEX sits at $0.18–$0.42 per m³ treated, dominated by aeration energy and membrane CIP chemicals; see the MBR operating cost in 2026 breakdown for the line-item model.
How often do MBR membranes need replacement, and what does it cost? PVDF flat-sheet membranes typically last 5–8 years; 2026 replacement cost is $25–$55 per m² of membrane area, amortized into OPEX as $0.02–$0.08 per m³ treated (per the MBR membrane replacement cost in 2026 pricing data).
Does an MBR system meet NEMC discharge requirements without a tertiary disinfection stage? For TSS, BOD, and COD, yes — MBR effluent sits under TZS 789:2018 limits in a single pass. For faecal coliform control, pair the MBR with a chlorine dioxide generator sized to the permitted residual.
Related Equipment
- automatic chemical dosing skid — specifications, capacity range, and technical data