
What MABR Capacity and Sizing Actually Means in 2026
MABR (Moving Bed Biofilm Reactor) capacity and sizing in 2026 is governed by three coupled parameters: specific surface area of the carriers (typically 800–1,200 m²/m³), oxygen transfer rate (OTR) of 8–14 g O₂/m²·d at standard conditions, and applied BOD loading of 0.8–1.5 kg BOD/m³·d. The standard sizing formula divides the daily BOD load by (specific surface area × OTR × biofilm efficiency) to derive the required carrier volume; a 500 m³/d municipal plant with 250 mg/L BOD typically needs 35–45 m³ of aerated MABR tankage, roughly 40% smaller than an equivalent CAS basin.
An MABR is a suspended-growth biofilm reactor: HDPE or PU carriers of 10–25 mm diameter (density 0.95–0.98 g/cm³, slightly buoyant) move freely in the aeration basin, with biomass attached as a 50–300 µm thick biofilm. The defining departure from an MBBR is oxygen delivery: in an MABR the carrier itself is the aeration membrane, so O₂ diffuses bubble-less into the biofilm from inside the carrier while substrate (BOD, NH₄-N) diffuses in from the bulk liquid. This counter-diffusion geometry is why the design reports active biomass as g COD/m² of carrier (typical 2024–2025 vendor range: 8–15 g COD/m²) rather than the MLVSS g/L convention used in activated sludge. For specifiers evaluating an integrated MBR membrane bioreactor skid (10–2,000 m³/day), the MABR often sits upstream as a high-rate roughing stage, replacing a conventional aeration tank.
The 2026 MABR Sizing Formula and a Worked 500 m³/d Example
The 2026 sizing backbone for an MABR reduces to one equation, with three engineering sensitivities layered on top:
- Core formula: V_MABR = (Q × S_BOD) / (SSA × OTR × η), where Q = design flow (m³/d), S_BOD = influent BOD (g/m³ = mg/L), SSA = specific surface area of carrier (m²/m³), OTR = standard oxygen transfer rate (g O₂/m²·d), η = biofilm efficiency factor (typically 0.70–0.85).
- Worked example: Q = 500 m³/d, S_BOD = 250 mg/L → daily load = 125 kg BOD/d. Using mid-range values SSA = 1,000 m²/m³, OTR = 12 g O₂/m²·d, η = 0.80 → required carrier volume ≈ 36 m³. At 25–30% volumetric carrier fill, total aerated tank volume = 120–150 m³, giving an HRT of 5.8–7.2 hours at design flow.
- Effluent-quality comparison, not volume: A CAS basin at 5–8 kg BOD/m³·d loading would need only 125 / 6 ≈ 21 m³ of aeration volume, but the MABR delivers COD ≤ 50 mg/L and simultaneous nitrification in one pass — the engineering comparison must be made on treated-effluent quality, not on raw tank volume.
Two sensitivities must be carried into every calculation. At bulk-liquid temperatures below 10 °C, reduce OTR by 15–25% (oxygen diffusion through the biofilm membrane and water film slows sharply), which directly inflates V_MABR. At influent salinity above 5 g/L TDS, drop η by 10–15% because osmotic stress on heterotrophs lowers substrate utilization. Both corrections are applied multiplicatively in the denominator of the formula, so a cold, high-salinity industrial influent can push the required carrier volume up by 30–40% versus a temperate municipal baseline.
Key MABR Design Parameters and Typical 2026 Ranges
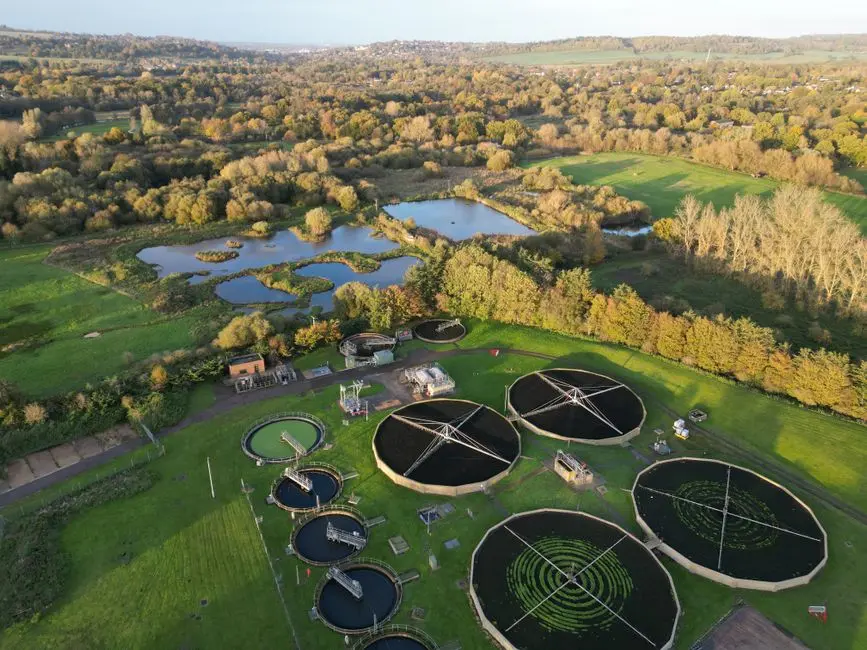
Table 1 below is the datasheet reference an engineer can paste into an RFP response or a P&ID title block. Every range reflects 2024–2026 commercial carrier datasheets and pilot-plant data; the design target column is the value to anchor a cost estimate against.
| Parameter | Unit | Typical 2026 range | Design target |
|---|---|---|---|
| Specific surface area (SSA) | m²/m³ | 800–1,200 | 1,000 |
| Oxygen transfer rate (OTR) | g O₂/m²·d | 8–14 | 12 |
| Carrier volumetric fill | % | 25–40 | 30 |
| Hydraulic retention time (HRT) | h | 4–8 | 6 |
| BOD loading rate | kg BOD/m³·d | 0.8–1.5 | 1.0 |
| NH₄-N loading rate | kg N/m³·d | 0.10–0.25 | 0.18 |
| Bulk-liquid dissolved oxygen | mg/L | 2–4 | 3 (indicator only) |
| Operating temperature | °C | 5–35 | 15–25 |
| Carrier diameter | mm | 10–25 | 15–20 |
| Carrier density | g/cm³ | 0.95–0.98 | 0.96 |
Two clarifications matter for reviewers. The 2–4 mg/L bulk DO band is a process indicator, not a control variable, because oxygen is delivered through the carrier membrane rather than through the bulk liquid. A reading below 1.5 mg/L almost always means aeration-panel failure or excessive biofilm sloughing, not a tuning issue. Carrier density in the 0.95–0.98 g/cm³ window keeps media in suspension without dedicated mixing energy, which is one reason the MABR's net kWh/m³ sits below MBBR's. For plants polishing the MABR effluent to reuse standards, a downstream PVDF flat-sheet MBR module raises recovery above 95% and pushes TSS below 1 mg/L.
MABR vs MBBR vs Conventional Activated Sludge: Capacity per m²
For a procurement lead comparing footprint at the same design point (500 m³/d, 250 mg/L BOD, effluent BOD ≤ 20 mg/L, NH₄-N ≤ 5 mg/L), the MABR lands 40–50% below the CAS footprint and 20–30% below the MBBR footprint, with the energy saving compounding the land saving. Table 2 is the benchmark.
| Technology | Footprint for 500 m³/d @ 250 mg/L BOD | Effluent BOD (mg/L) | Effluent NH₄-N (mg/L) | Energy (kWh/m³) |
|---|---|---|---|---|
| MABR | 120–150 m³ (single pass, simultaneous nitrification) | ≤ 20 | ≤ 5 | 0.25–0.45 |
| MBBR | 200–250 m³ (typically two stages for nitrification) | ≤ 20 | ≤ 5 (stage 2 required) | 0.40–0.60 |
| Conventional Activated Sludge | 250–350 m³ plus separate clarifier (~80 m³) | ≤ 20 | ≤ 5 (long SRT required) | 0.50–0.80 |
Energy figures are drawn from 2024–2025 vendor and municipal benchmark datasheets (Fluence, SUEZ, Veolia published numbers) and align with municipal plant operating data. The trade-off is biological phosphorus removal: MABR's counter-diffusion geometry is weaker for phosphorus-accumulating organisms than the alternating anaerobic/aerobic exposure of CAS, so a plant targeting <0.5 mg/L TP should plan either a hybrid MABR + chemical precipitation stage or a downstream MBR polish. For sites chasing both tight P limits and water-reuse credits, the combination is detailed in the food-processing MBR cost and ROI benchmark.
Modular Scale-Up: From 10 m³/d Pilot to 5,000 m³/d Skid
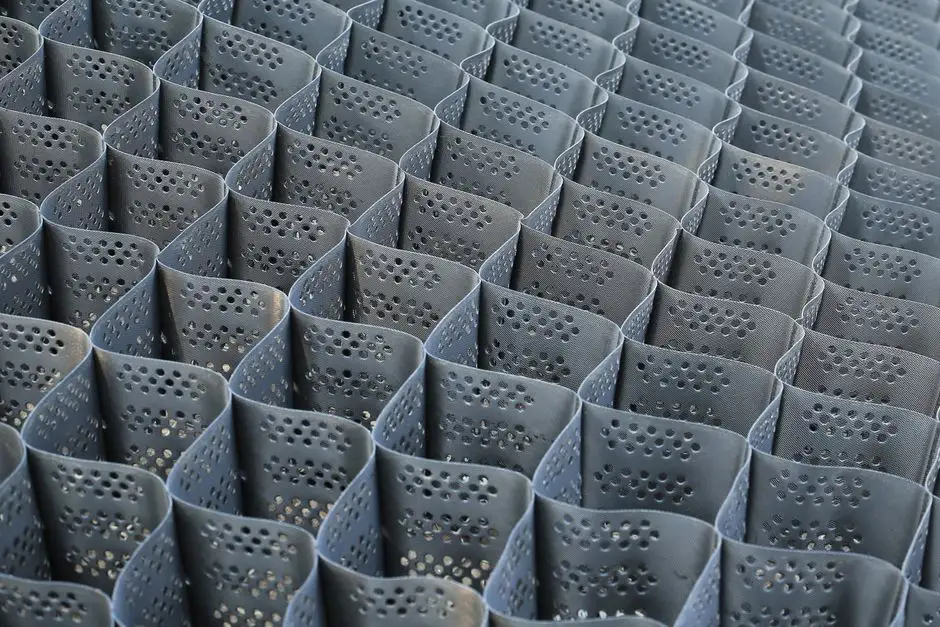
The single most important scaling claim for MABR is geometric: OTR per m² of carrier is essentially geometry-independent below 50 m³ reactor size, so pilot data transfers directly to commercial scale without re-deriving the formula. That property is what makes the modular ladder work in 2026:
- 10–50 m³/d pilot: bench- or trailer-scale, single aeration panel, used to confirm η and temperature correction against real influent — typically a 60–90 day trial.
- 100–500 m³/d containerized skid: 20-ft or 40-foot ISO footprint, factory-assembled, shipped with carriers pre-loaded; the same formula and the same OTR apply, only the carrier count grows.
- 1,000–5,000 m³/d commercial plant: concrete or packaged-tank construction with multiple aeration panels; design math is identical to the skid, with redundancy added at the blower and panel level.
The packaged-modular step is where 2026 procurement really wins: a 500 m³/d skid can be delivered in 8–12 weeks versus 6–9 months for a cast-in-place basin. For specifiers comparing MABR's compact footprint against the established MBR packaged-skid market, the 2026 MBR market sizing and CAGR data confirms containerized delivery is now the default expectation in the 10–2,000 m³/d band.
2026 CAPEX and OPEX Band for MABR Plants
For procurement planning only, not as a quotation: turnkey MABR systems in 2026 sit at roughly USD 250–600 per m³/d of design capacity for industrial flows and USD 180–400 per m³/d for municipal flows, with the spread driven by influent matrix, effluent limits, and seismic/winterization requirements (2024–2025 industry benchmarks). OPEX is dominated by aeration energy and carrier replacement at the 10–15 year mark; typical operating cost is USD 0.10–0.25 per m³ treated, which lines up with the energy band of 0.25–0.45 kWh/m³ quoted in Table 2. Final figures will move with influent COD/N ratio, local power tariffs, and whether polishing to reuse standards requires a downstream membrane stage. Pair these planning numbers with the food-processing MBR cost and ROI benchmark when the project needs reuse-grade effluent and a tighter CAPEX envelope.
Frequently Asked Questions

What is the standard MABR sizing formula for 2026?
Required carrier volume V_MABR = (Q × S_BOD) / (SSA × OTR × η), with Q in m³/d, S_BOD in g/m³, SSA in m²/m³, OTR in g O₂/m²·d, and η (biofilm efficiency) typically 0.70–0.85. Tank volume is V_MABR divided by carrier fill (25–40%).
How does MABR footprint compare with MBBR for the same duty?
For 500 m³/d at 250 mg/L BOD, MABR needs 120–150 m³ of aeration volume with simultaneous nitrification, while MBBR needs 200–250 m³ in two stages. MABR is typically 20–30% smaller in footprint and 30–40% lower in energy.
How do I correct MABR OTR for low temperature or high salinity?
Below 10 °C, reduce the design OTR by 15–25%; above 5 g/L influent TDS, reduce η by 10–15%. Both corrections are applied multiplicatively and together can increase the required carrier volume by 30–40%.
Can an MABR be containerized and shipped as a skid?
Yes. MABR's OTR per m² is geometry-independent below 50 m³, so a 100–500 m³/d containerized skid delivers the same performance as a cast-in-place basin. 2026 lead time for a skid is 8–12 weeks versus 6–9 months for basin construction.
Can one MABR pass deliver BOD removal and nitrification together?
Yes. Counter-diffusion geometry lets heterotrophs and nitrifiers coexist in the same biofilm, so a single MABR pass at 1.0 kg BOD/m³·d typically achieves BOD ≤ 20 mg/L and NH₄-N ≤ 5 mg/L without a second stage.