Why Water Constrains Green Hydrogen Projects in 2026
Green hydrogen demand trends for 2026 still understate process-water risk: plants need roughly 9–22 L of high-purity water per kg H2 (PEM ~9 L/kg stoichiometric; alkaline ~18 L/kg with BoP losses). A 100 MW PEM unit at ~60% capacity factor typically draws 60,000–80,000 m³/yr with cooling reuse, via RO plus polishing to <1 µS/cm.
Production needs roughly 9–22 liters of high-purity water per kilogram of H2, depending on electrolyzer technology (PEM ~9 L/kg, alkaline ~18 L/kg including balance-of-plant losses). A 100 MW PEM plant at ~60% capacity factor can hit 4–6 million m³/yr treated water at the upper bound. Realistic inland designs land closer to 60,000–80,000 m³/yr when cooling reuse is applied. The RO plus mixed-bed polishing train to <1 µS/cm remains a critical CAPEX and permitting line item in 2026 project design.
The IEA's 2024–2025 pathway reports project tens of millions of cubic meters of incremental industrial water demand annually from electrolyzer additions through 2030 (per IEA Global Hydrogen Review 2024). Most hydrogen project developers still under-resource the water scope. Roughly 98% of current hydrogen production remains tied to fossil-feedstock routes (per Bramble Energy / industry context). Electrolytic scale-up is therefore a step-change in water demand, not a marginal increment.
Three water streams are typically scoped separately: process feed water (purified to electrolyzer spec), cooling and balance-of-plant water (often cooling-tower makeup), and demineralized rinse water for stack conditioning. Each has its own quality bar, its own unit cost, and its own permitting footprint — and they are rarely additive in a water balance. Feasibility models price water per kilogram of H2, not per MWh, because that is the unit financial and LCA models use.
Every kilogram of hydrogen produced requires a stoichiometric kilogram of water input plus balance-of-plant losses. The engineering job is to minimize the multiplier on that kilogram while staying inside the conductivity, chloride, and silica envelope the stack will accept for 80,000 operating hours. Most plants we size for inland sites run at the lower end of the cooling adder once cycles of concentration are locked in early.
Green hydrogen demand trends: how much water per kilogram?
Per-kilogram water consumption for a green hydrogen plant ranges from ~9 L for a well-instrumented PEM system to ~18 L for an alkaline system once balance-of-plant losses are included. SOEC units sit between the two at 10–14 L/kg but with tighter purity constraints. These numbers belong in the feasibility water balance. They are stable across 2024–2026 vendor datasheets.
| Electrolyzer type | Stoichiometric feed water (L/kg H2) | Typical BoP losses (L/kg) | Total feed water (L/kg) | Cooling water adder (% of feed) |
|---|---|---|---|---|
| PEM | 9 | 1–3 | 10–12 | 30–50 |
| Alkaline | 9–11 | 5–7 | 14–18 | 40–60 |
| SOEC (R&D / pilot) | 9 | 1–5 | 10–14 | 30–40 |
Worked example for a 100 MW PEM plant at 60% capacity factor: annual hydrogen output is ~4,500 tonnes (assuming ~50 kWh/kg stack efficiency). Feed-water demand is ~50,000 m³/yr at 11 L/kg. Cooling-tower makeup adds another ~25,000 m³/yr at 40% — totaling roughly 75,000 m³/yr of treated and makeup water.
Scale that to 1 GW and the plant approaches 0.5–0.7 million m³/yr of treated feed water, equivalent to the daily supply of a town of 25,000–30,000 people. Three parameters move the result by ±30%: capacity factor (50% vs 75% shifts H2 output by 50%), stack specific consumption (45 vs 55 kWh/kg), and the cooling-tower cycles-of-concentration setting, which controls blowdown. A project board looking at this needs to know that a 10% swing in capacity factor is roughly a 5,000 m³/yr swing in feed water at 100 MW scale.
At GW scale, green hydrogen demand trends push water balance into the same board pack as power PPAs. Skip that step and you discover the shortfall only after the electrolyzer PO is signed.
Feed-Water Quality Requirements: What Electrolyzer Makers Actually Demand
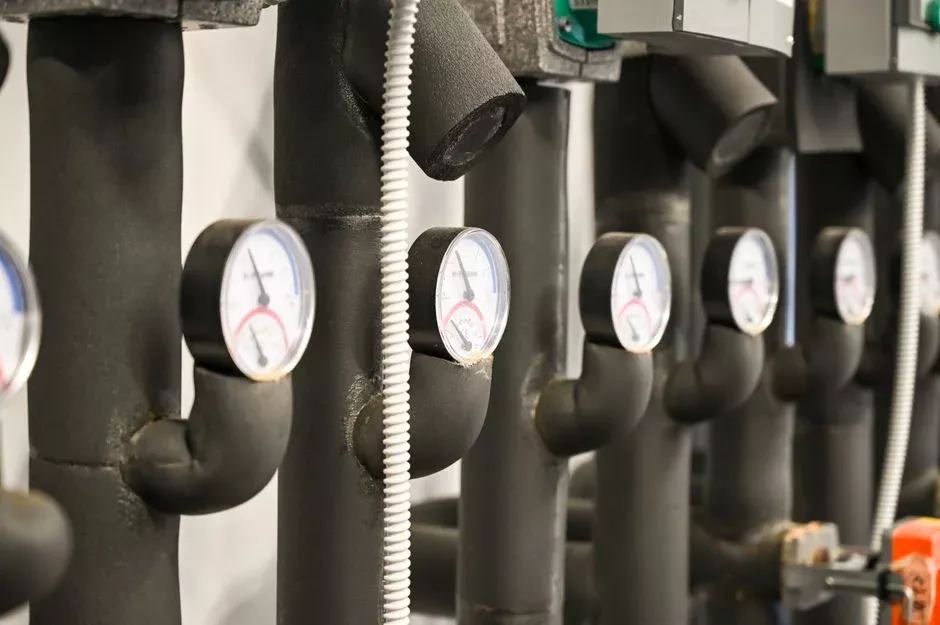
PEM electrolyzer feed water must meet a <1 µS/cm conductivity, <50 ppb TOC, <10 ppb silica, and <0.1 ppm chloride specification in 2024–2025 manufacturer datasheets. Alkaline stacks accept a wider envelope of up to ~5 µS/cm but still require chloride control to protect stainless components. SOEC units are the strictest on most parameters and operate at 700–800 °C, which amplifies silica fouling on heat exchangers but reduces chloride-driven membrane attack.
| Parameter | PEM spec (typical 2024–2025 datasheet) | Alkaline spec (typical) | SOEC spec (pilot) | Why it matters |
|---|---|---|---|---|
| Conductivity | <1 µS/cm | <5 µS/cm | <0.5 µS/cm | Ionic contamination degrades membrane and electrodes |
| TOC | <50 ppb | <1,000 ppb | <50 ppb | Organic carryover fouls catalysts and GDEs |
| Silica (SiO2) | <10 ppb | <500 ppb | <10 ppb | Silica scales on heat exchangers and RO membranes; very hard to remove downstream |
| Chloride | <0.1 ppm | <0.5 ppm | <0.05 ppm | Chloride pits 316L stainless and attacks PEM membranes irreversibly |
| Iron / manganese | <0.01 ppm | <0.1 ppm | <0.01 ppm | Catalyst poisoning and discoloration in alkaline loops |
| Residual free chlorine | Not detectable | Not detectable | Not detectable | Oxidizer attack on membrane |
Silica and chloride are the two silent killers on hydrogen water trains. Silica fouling on the polishing-loop heat exchangers and on the final RO pass is the most common cause of progressive throughput loss. Chloride breakthrough during a polishing-resin exhaustion event can take out a PEM membrane in hours.
Online conductivity at the polishing outlet is the single most useful sensor for protecting the stack — the Mettler-Toledo application note on green-hydrogen conductivity monitoring lays out the same logic. TOC and silica analyzers are slower but should be trended continuously for 2026 designs. If the source water is variable (a real risk for treated wastewater or surface water), redundant polishing trains with automatic diversion-to-drain on conductivity excursion are becoming standard rather than optional.
Source-Water Options: Tap, Groundwater, Treated Wastewater, or Seawater?
Source-water choice is the single most consequential decision in the project water plan. It drives pretreatment CAPEX, ongoing OPEX, permitting timeline, and ESG narrative, and it is decided long before the electrolyzer PO is signed. In 2025–2026 industrial tariffs across the US, EU, Middle East, and Australia, the unit cost spread between the four main options is roughly 5–8×. Treatment intensity spreads even wider.
| Source | Typical conductivity (µS/cm) | Indicative 2025–2026 OPEX ($/m³ treated) | Treatment intensity | Best-fit project profile |
|---|---|---|---|---|
| Tap / municipal | 200–800 | $0.50–1.50 | Low (RO + polishing only) | Fast-track, small-scale, water-rich regions |
| Groundwater / borehole | 300–1,500 | $0.20–0.70 | Medium (iron/manganese removal + softening + RO) | Inland sites with stable aquifer permits |
| Treated municipal wastewater | 500–1,500 | $0.20–0.60 | High (MBR + RO + AOP + polishing) | ESG-led projects, water-stressed inland regions |
| Seawater (coastal) | 45,000–55,000 | $0.30–0.80 (SWRO finished) | Very high (intake + SWRO + boron-selective + polishing) | Coastal mega-projects in Middle East, Chile, Australia |
Tap water has the fastest permitting path and the lowest pretreatment CAPEX, but the highest unit OPEX and a social-license problem in any water-stressed basin. A 100 MW plant at $1.00/m³ is $60,000–80,000/yr of just water tariff, before any treatment. Groundwater is the cheapest by unit cost but increasingly difficult to permit in the US West, Spain, and northern China, and requires iron, manganese, and hardness removal before RO.
Treated municipal wastewater has become the lowest-OPEX option in many jurisdictions and a strong ESG story under CSRD reporting. It still needs MF/UF + RO + AOP to land inside the electrolyzer envelope, and public-perception work is non-trivial. Seawater via SWRO plus boron-selective resin polishing is now the lowest-risk path for coastal mega-projects in the Middle East, Chile, and Australia. It competes on OPEX with treated wastewater once intake and discharge permits are secured.
The decision logic in 2026 is driven less by chemistry than by three external variables: distance to coast, local water-stress index, and the realism of obtaining a discharge permit for RO concentrate. Most coastal FEED packages we review pick SWRO early once discharge modeling clears the intake site.
The 2026 Treatment Train: From Raw Water to Electrolyzer Feed
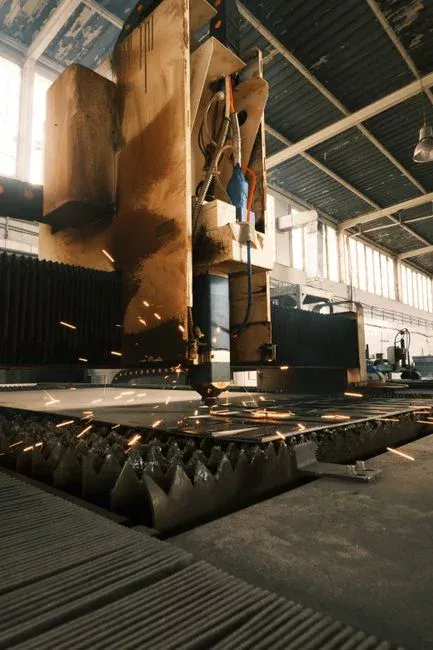
The 2026 default inland train is multimedia filtration → ultrafiltration or DAF → brackish-water RO → EDI or mixed-bed polishing → 0.2 µm final filter. Polishing-outlet conductivity is verified online before water touches the stack. For seawater, the train is intake screens → DAF/MF → two-pass SWRO → boron-selective ion exchange → EDI. For reclaimed wastewater, the train is MBR system for reclaimed-wastewater feed to a hydrogen plant → RO → EDI, which cuts source-water cost by 40–60% versus municipal tap at typical 2025–2026 industrial tariffs.
Two details decide train life. The multi-media filter for source-water pretreatment upstream of RO sets how often membranes clean and how long they last. The industrial RO system for electrolyzer feed-water polishing sets the salt and silica load the polishing resins must handle. A 30–70% recycle of polishing reject is feasible on most designs and should be locked in from day one. That recycle lowers net water use and RO concentrate volume — the biggest inland discharge-permitting issue.
Online monitoring at the polishing outlet (conductivity, TOC, silica) supports fast diversion to drain on any out-of-spec event. It is the cheapest insurance against a stack replacement. For regional permitting and reuse context, see the industrial wastewater treatment in San Francisco engineering guide. The high-strength organic wastewater treatment engineering specs piece walks the same design constraints in more detail.
Cost, Risk, and Permitting: The 2026 Project View
Water treatment CAPEX for a 2025–2026 green hydrogen project runs $0.5–2.0 million per 10 MW of electrolyzer capacity depending on source water. OPEX runs $0.20–1.50 per cubic meter of treated water, dominated by RO pump energy plus membrane and resin replacement. A 100 MW inland project on treated wastewater should budget $8–15 million of water-treatment CAPEX and ~$0.4–0.8 million/yr of OPEX. A 100 MW coastal seawater project runs 20–40% higher CAPEX for SWRO and boron-selective resin, but lower raw-water tariff.
Water treatment is typically 3–6% of total project CAPEX but it drives 30%+ of the permitting timeline in 2026, and that ratio is what makes it a board-level item rather than a procurement detail. Permitting friction in 2026 is real and tightening. The EU's CSRD water-stress screening now requires disclosed water-withdrawal figures at the project level for any project above 1 MW, and large groundwater rights transfers in the US West are triggering NEPA review.
China's dual-carbon policy is actively favoring treated-wastewater reuse, which is why inland Chinese projects in Inner Mongolia and Xinjiang are increasingly specced on MBR + RO rather than fresh groundwater. The single biggest non-technical risk in 2026 is RO concentrate discharge: inland mega-projects are now expected to design for zero-liquid-discharge (ZLD) using a thermal brine concentrator and crystallizer, which can double the water-treatment CAPEX. For a closer look at the membrane side of this trend, the membrane technology market growth 2026 analysis is a useful reference.
Selection Checklist and Cost Drivers
Project teams locking a water scope before FEED should walk this checklist in order, not as a procurement afterthought. Skipping any item usually shows up as a late CAPEX spike or a stalled discharge permit.
- Confirm electrolyzer type (PEM / alkaline / SOEC) and lock feed-water conductivity, TOC, silica, and chloride limits from the vendor datasheet.
- Build the water balance at L/kg H2 and m³/yr for process feed, cooling makeup, and rinse water at the design capacity factor.
- Rank source options (tap, groundwater, treated wastewater, seawater) by tariff, treatment intensity, and discharge realism for RO concentrate.
- Size pretreatment for the worst-case silica and iron load; undersized multimedia or UF stages shorten RO life faster than any other error we see on site.
- Specify online conductivity at the polishing outlet with automatic diversion-to-drain before water can reach the stack.
- Budget water-treatment CAPEX at $0.5–2.0 million per 10 MW and OPEX at $0.20–1.50/m³, then stress-test ZLD if inland concentrate discharge is blocked.
- Document CSRD / local water-stress disclosure needs early if the project exceeds 1 MW and will report withdrawal volumes.
Who This Is For / Next Step
This guide is for EPC water leads, owner’s engineers, and procurement managers sizing green hydrogen plants from about 10 MW upward. Teams chasing only fuel-cell R&D skids under a few hundred kilograms per day should look elsewhere — the CAPEX and permitting logic here is built for industrial trains. For a scoped RO / MBR / polishing package matched to your source water and stack spec, request a hydrogen feed-water treatment quote with capacity factor, source conductivity, and electrolyzer type attached.
Frequently Asked Questions
How many liters of water to make 1 kg of green hydrogen?
Approximately 9–12 L for a PEM system and 14–18 L for an alkaline system once balance-of-plant losses are included, per typical 2024–2025 electrolyzer manufacturer datasheets. Stoichiometric feed sits near 9 L/kg for PEM; BoP losses add 1–3 L/kg on PEM and 5–7 L/kg on alkaline trains. Use the total feed column in the water-balance table above when you size annual m³ demand, not the stoichiometric line alone.
Can seawater be used for hydrogen electrolysis?
Yes — seawater reverse osmosis (SWRO) followed by boron-selective resin polishing and EDI is the standard 2026 configuration for coastal mega-projects in the Middle East, Chile, and Australia. Finished OPEX typically lands around $0.30–0.80/m³ once intake and discharge permits are secured. Direct seawater feed to the stack is not the industrial path; the polishing train still has to hit PEM or alkaline conductivity limits before water touches the electrolyzer.
What is the minimum water purity for a PEM electrolyzer?
Conductivity below 1 µS/cm, TOC below 50 ppb, silica below 10 ppb, and chloride below 0.1 ppm per typical 2024–2025 PEM manufacturer feed-water specifications. Alkaline stacks often accept up to about 5 µS/cm but still need tight chloride control for stainless loops. Online conductivity at the polishing outlet remains the fastest trip signal when any of those limits start to drift.
Can treated wastewater feed a hydrogen plant?
Yes — MBR followed by RO and EDI hits the electrolyzer spec, and treated wastewater is the lowest-OPEX source option in 2025–2026 industrial tariffs at $0.20–0.60/m³. Expect higher pretreatment intensity than municipal tap, including AOP where organics or micropollutants drive TOC risk. Public-perception work and concentrate discharge planning still sit on the critical path for inland reuse schemes.
How much water does a 100 MW hydrogen plant use per year?
A 100 MW PEM plant at 60% capacity factor uses approximately 50,000 m³/yr of purified feed water plus 20,000–30,000 m³/yr of cooling-tower makeup — roughly 70,000–80,000 m³/yr total. At 11 L/kg feed and ~4,500 tonnes H2/yr, the process line alone is near 50,000 m³/yr before cooling. A 10% capacity-factor swing moves feed water by about 5,000 m³/yr at this scale.