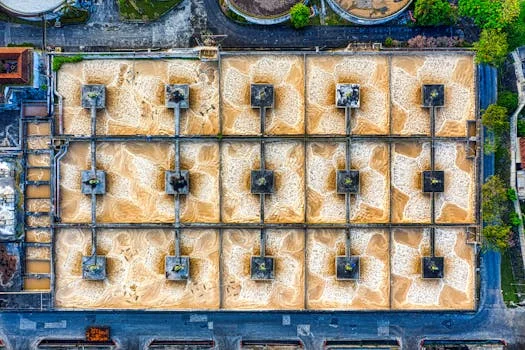
Ontario operates over 400 municipal sewage treatment plants, treating approximately 4.5 billion liters of wastewater daily—equivalent to 1,800 Olympic-sized swimming pools. The province’s largest facility, Toronto’s Ashbridges Bay, processes 818,000 m³/day (2024 data), while smaller plants like Grand Valley handle 200–500 m³/day. Key engineering benchmarks include BOD removal rates of 90–98% (MOECC 2023 standards) and energy consumption of 0.3–0.6 kWh/m³. This guide provides 2025 technical specifications, compliance requirements, cost benchmarks, and equipment selection criteria for engineers and procurement teams evaluating wastewater treatment stages for municipal sewage treatment plant in Ontario Canada.
Ontario’s Municipal Sewage Treatment Landscape: 2025 Data and Trends
Ontario’s municipal sewage treatment infrastructure comprises over 400 facilities collectively treating 4.5 billion liters of wastewater per day (MOECC 2024). This extensive network primarily relies on conventional activated sludge systems, which account for approximately 60% of all plants, followed by lagoons at 25%, and advanced treatment technologies like Membrane Bioreactors (MBR) and Sequencing Batch Reactors (SBR) making up the remaining 15%. The Nova Scotia’s municipal sewage treatment landscape, in comparison, features a similar mix but with a higher proportion of lagoon systems.
Plant capacity distribution in Ontario shows a significant number of smaller facilities: 50% of plants treat less than 5,000 m³/day, 30% handle volumes between 5,000 and 50,000 m³/day, and only 20% exceed 50,000 m³/day. A typical capacity histogram would show a long tail of small plants, with a few large facilities dominating total provincial treatment capacity. The age profile of these plants indicates a pressing need for upgrades, with 40% built prior to 1990, 35% between 1990 and 2010, and only 25% constructed after 2010 (Ontario Clean Water Agency 2023 report). Geographically, Southern Ontario hosts 60% of the plants and 70% of the total treatment capacity, while Northern Ontario has 30% of plants but only 15% of capacity, and Eastern Ontario accounts for 10% of plants and 15% of capacity.
Key challenges facing Ontario’s municipal wastewater sector include aging infrastructure, with 30% of plants rated 'poor' or 'very poor' in 2023 MOECC inspections. Climate resilience is another critical concern, as approximately 20% of plants are at risk of flooding. evolving environmental standards necessitate nutrient removal upgrades, with 50% of plants requiring enhanced phosphorus reduction by 2028 to protect sensitive ecosystems.
| Metric | Data Point | Source/Notes |
|---|---|---|
| Total Plants | >400 | MOECC 2024 |
| Total Volume Treated | 4.5 billion L/day | MOECC 2024 |
| Dominant Technology | 60% Activated Sludge | Ontario Clean Water Agency 2023 |
| Plant Age (<1990) | 40% | Ontario Clean Water Agency 2023 |
| Plants <5,000 m³/day | 50% | Ontario Clean Water Agency 2023 |
| Infrastructure Rating ('Poor'/'Very Poor') | 30% | MOECC 2023 Inspections |
Engineering Benchmarks: Removal Rates, Energy Use, and Sludge Production
Achieving optimal performance in a municipal sewage treatment plant in Ontario Canada requires adherence to stringent engineering benchmarks for removal rates, energy consumption, and sludge production. For conventional activated sludge systems, BOD (Biological Oxygen Demand) and TSS (Total Suspended Solids) removal rates typically range from 90–98%, aligning with MOECC 2023 discharge limits of 25 mg/L for both parameters. Lagoon systems, while simpler, offer 70–85% removal, with significant seasonal variation; winter operations can see rates as low as 60%, improving to 90% in summer.
Energy consumption is a critical operational cost. Activated sludge plants generally consume 0.3–0.6 kWh/m³ of treated wastewater, with aeration accounting for approximately 50% of this demand, pumping 30%, and other processes 20%. Lagoon systems are significantly less energy-intensive, requiring 0.1–0.3 kWh/m³. Sludge production varies by treatment type; activated sludge generates 0.2–0.4 kg dry solids/m³ treated, while lagoons produce 0.05–0.15 kg/m³ due to longer retention times and lower biomass concentrations. Chemical dosing for phosphorus removal, primarily using ferric chloride, typically ranges from 10–30 mg/L, incurring a cost of $0.05–$0.15/m³. Polymer dosing for sludge conditioning is usually 1–3 mg/L.
Process efficiency trade-offs are central to equipment selection. Membrane Bioreactor (MBR) systems achieve superior BOD removal rates of 99% and produce effluent suitable for reuse, but they come with higher energy demands, typically 0.8–1.2 kWh/m³, due to membrane scour and higher aeration requirements. Dissolved Air Flotation (DAF) systems, such as high-efficiency DAF systems for FOG and solids removal in Ontario plants, can effectively remove 90% of Fats, Oils, and Grease (FOG), with energy consumption ranging from 0.4–0.7 kWh/m³. For small communities requiring compact and efficient solutions, compact underground sewage treatment systems for small Ontario municipalities, often incorporating MBR technology, offer high-quality effluent within a minimal footprint. These integrated solutions are particularly relevant for areas with limited land availability or stringent discharge requirements, offering an excellent balance of treatment efficiency and operational flexibility, similar to larger MBR integrated wastewater treatment plants.
| Parameter | Activated Sludge | Lagoon Systems | MBR Systems |
|---|---|---|---|
| BOD Removal Rate | 90–98% | 70–85% (seasonal) | >99% |
| TSS Removal Rate | 90–98% | 70–85% (seasonal) | >99% |
| Energy Consumption (kWh/m³) | 0.3–0.6 | 0.1–0.3 | 0.8–1.2 |
| Sludge Production (kg dry solids/m³) | 0.2–0.4 | 0.05–0.15 | 0.3–0.5 |
| Typical Phosphorus Removal | Chemical (10-30 mg/L FeCl₃) | Limited, natural uptake | Enhanced Biological/Chemical |
Compliance Framework: Ontario Regulations, Discharge Limits, and Reporting Requirements
Navigating the intricate regulatory landscape is paramount for any municipal sewage treatment plant in Ontario Canada to ensure operational compliance and avoid significant penalties. The primary legislative instruments governing sewage treatment in the province are the Ontario Water Resources Act (OWRA) and the Environmental Protection Act (EPA). These acts establish the framework for wastewater discharge permits, treatment standards, and environmental protection.
Beyond provincial legislation, the federal Canada Fisheries Act imposes strict prohibitions on the deposit of deleterious substances into waters frequented by fish. This includes specific limits for parameters like ammonia (>19 mg/L) and chlorine (>0.02 mg/L), which can be acutely toxic to aquatic life. The Ministry of the Environment, Conservation and Parks (MOECC) sets provincial discharge limits (2023) for key parameters: BOD 25 mg/L, TSS 25 mg/L, and E. coli 200 CFU/100 mL. Phosphorus limits are particularly stringent in sensitive watersheds, such as the Lake Simcoe watershed, where the limit is 0.5 mg/L.
Local bylaws can impose even stricter requirements. For example, the City of Toronto mandates a phosphorus limit of 0.1 mg/L for plants exceeding 50,000 m³/day, while the Niagara Region requires tertiary filtration for plants discharging into the Niagara River. To demonstrate continuous compliance, facilities larger than 5,000 m³/day must submit monthly discharge monitoring reports (DMRs), and all plants are required to submit annual environmental compliance reports (ECRs). Emerging regulations include pilot programs for microplastics monitoring in 2025 and proposed PFAS (per- and polyfluoroalkyl substances) limits of 70 ng/L for PFOA/PFOS by 2027, necessitating advanced treatment considerations, which may include specialized systems for medical wastewater treatment if such discharges enter the municipal system. Effective disinfection using technologies like on-site chlorine dioxide generators for residual-free disinfection can help meet stringent microbiological discharge limits without forming harmful disinfection byproducts.
Cost Breakdown: Capital, O&M, and Funding Sources for Ontario Plants
Understanding the financial implications is critical for any upgrade or new build of a municipal sewage treatment plant in Ontario Canada. Capital costs for wastewater treatment infrastructure in 2025 (USD) vary significantly by plant size and technology. Small plants with capacities under 5,000 m³/day can expect capital costs ranging from $5–10M. Medium-sized plants, treating 5,000–50,000 m³/day, typically incur $20–50M, while large facilities over 50,000 m³/day can cost $100–300M (Ontario Clean Water Agency 2024). These figures include land acquisition, civil works, equipment procurement, and installation.
Operational and Maintenance (O&M) costs also exhibit a wide range. Activated sludge systems generally have O&M costs between $0.30–$0.80/m³ of treated wastewater. This breaks down roughly into labor (40%), energy (30%), chemicals (20%), and maintenance (10%). Lagoon systems, due to their simpler operation, typically have lower O&M costs, ranging from $0.10–$0.30/m³. Sludge disposal is a substantial component of O&M, with costs ranging from $150–$300/tonne for landfill disposal and $50–$100/tonne for beneficial land application (MOECC 2023 data). Efficient sludge dewatering equipment selection guide for Canadian plants can significantly reduce disposal volumes and associated costs.
Various funding sources are available to help municipalities offset these substantial costs. The Canada Community-Building Fund (formerly Gas Tax Fund) can contribute up to 33% of capital project costs. The Ontario Municipal Partnership Fund (OMPF) provides unconditional operating grants to municipalities, which can be allocated to water and wastewater services. Additionally, low-interest loans from Infrastructure Ontario are a common mechanism for financing large infrastructure projects. Return on Investment (ROI) can be driven by strategic investments: energy-efficient blowers can yield up to 30% savings in aeration costs, while automated chemical dosing systems, such as an automatic chemical dosing system, can reduce chemical consumption by 20%. MBR systems, despite higher capital, often offer a 50% smaller footprint and up to 20% lower O&M due to reduced sludge production and superior effluent quality.
| Plant Capacity (m³/day) | Typical Capital Cost (USD) | O&M Cost (Activated Sludge, $/m³) | Sludge Disposal Cost ($/tonne) |
|---|---|---|---|
| <5,000 | $5–10M | $0.50–$0.80 | $150–$300 (landfill) |
| 5,000–50,000 | $20–50M | $0.40–$0.60 | $150–$300 (landfill) |
| >50,000 | $100–300M | $0.30–$0.50 | $50–$100 (land application) |
Equipment Selection Guide: Process Flow Diagrams and Technology Trade-Offs
Selecting the appropriate equipment for a municipal sewage treatment plant in Ontario Canada depends on influent characteristics, desired effluent quality, land availability, and budget. Common process flow diagrams for secondary treatment include Conventional Activated Sludge (CAS), Sequencing Batch Reactors (SBR), Membrane Bioreactors (MBR), and lagoons. CAS systems involve primary clarification, aeration tanks, and secondary clarifiers, followed by disinfection. SBRs integrate aeration, sedimentation, and decantation into a single tank, operating in batches. MBR systems replace secondary clarifiers and often tertiary filtration with membranes, producing high-quality effluent. Lagoons provide treatment through natural biological processes in large, shallow ponds.
Each technology presents distinct trade-offs. CAS systems offer relatively low O&M costs but require a large footprint. MBR systems, utilizing advanced MBR membrane bioreactor modules, achieve superior removal rates and a much smaller footprint, ideal for urban areas, but have higher energy demands. SBRs offer operational flexibility and can handle variable flows but require more complex controls. Lagoons are the lowest cost option, especially for small communities, but are subject to seasonal performance limitations and require extensive land.
Pretreatment equipment is essential for protecting downstream processes. Rotary screens, such as GX Series rotary mechanical bar screens, efficiently remove large solids, preventing pump damage and clogging. High-efficiency DAF systems for FOG and solids removal in Ontario plants achieve 90% efficiency for FOG and suspended solids, operating at 0.4–0.7 kWh/m³ and are crucial for industrial wastewater contributions. For secondary treatment, MBR integrated wastewater treatment plants provide reuse-quality effluent with BOD typically below 1 mg/L. For smaller communities, compact underground sewage treatment systems for small Ontario municipalities (WSZ Series) offer integrated solutions with capacities from 1–80 m³/h.
Disinfection is the final critical step. On-site chlorine dioxide generators for residual-free disinfection (ZS Series) are EPA-approved, ensure a 99.9% kill rate against pathogens, and avoid the formation of harmful trihalomethanes (THMs). UV disinfection is also viable for smaller plants (under 5,000 m³/day). Sludge handling involves equipment like sludge dewatering equipment for Ontario’s 400+ municipal plants (plate and frame filter presses, 1 m²–500 m²), which can achieve 20–30% dry solids content, significantly reducing disposal volume. High-efficiency sedimentation tanks, such as lamella clarifiers, provide enhanced solid-liquid separation with high surface loading rates (20–40 m/h).
| Technology | Key Advantages | Key Disadvantages | Typical Application |
|---|---|---|---|
| Conventional Activated Sludge (CAS) | Proven, low O&M, robust | Large footprint, moderate effluent quality | Large to medium plants with space |
| Membrane Bioreactor (MBR) | High effluent quality (reuse), small footprint | High capital & energy costs, membrane fouling | Urban areas, stringent discharge, water reuse |
| Sequencing Batch Reactor (SBR) | Flexible operation, good nutrient removal | Complex controls, batch operation | Variable flow rates, smaller to medium plants |
| Lagoons | Low capital & O&M, simple | Large land requirement, seasonal performance | Small, rural communities with ample land |
Emerging Technologies: MBR, ClO₂ Disinfection, and Smart Monitoring
Ontario’s municipal wastewater sector is increasingly adopting emerging technologies to enhance efficiency, meet stricter regulations, and improve climate resilience. Membrane Bioreactor (MBR) systems are leading this shift, offering 99% BOD removal and a 60% smaller footprint compared to conventional activated sludge. This makes MBR ideal for urban plants facing land constraints, exemplified by Toronto’s Ashbridges Bay pilot project, which reuses 95% of its MBR-treated water for irrigation, demonstrating the potential for water reclamation in the province. MBR integrated wastewater treatment plants are becoming a standard for future-proofing.
Disinfection technology is also advancing. On-site chlorine dioxide generators for residual-free disinfection are EPA-approved and provide a 99.9% kill rate against a broad spectrum of pathogens without forming harmful disinfection byproducts like THMs. The Niagara Falls plant, for instance, reduced chlorine use by 40% after retrofitting with ClO₂. Smart monitoring and control systems are optimizing plant operations. Real-time sensors for BOD, TSS, and ammonia, coupled with AI-driven aeration control, have enabled plants like Timmins to reduce energy consumption by 15% through optimized blower operation and dissolved oxygen management.
Phosphorus recovery is gaining traction as a sustainable practice. Struvite crystallization processes, such as those implemented at the Guelph plant, recover 80% of phosphorus as a valuable fertilizer, simultaneously reducing chemical costs for precipitation by 30%. Finally, climate resilience measures are becoming standard design considerations. Windsor’s Lou Romano plant, for example, elevated critical equipment 2 meters above the 100-year floodplain, illustrating proactive flood-proofing strategies essential for protecting infrastructure against increasingly frequent extreme weather events.
Frequently Asked Questions
What is the largest wastewater treatment plant in Ontario?
Toronto’s Ashbridges Bay Wastewater Treatment Plant is the largest in Ontario, processing an impressive 818,000 m³/day (2024 data). The second-largest facility is Hamilton’s Woodward Avenue plant, with a capacity of 409,000 m³/day.
How many wastewater treatment plants are there in Toronto?
The City of Toronto operates four municipal wastewater treatment plants. These include Ashbridges Bay (818,000 m³/day), Highland Creek (341,000 m³/day), Humber (473,000 m³/day), and North Toronto (45,000 m³/day), collectively serving the city's vast population.
How much does a municipal sewage treatment plant cost in Ontario?
Capital costs for a municipal sewage treatment plant in Ontario vary significantly by size, ranging from $5M for smaller plants (under 5,000 m³/day) to $300M for very large facilities (over 50,000 m³/day). Operational and maintenance (O&M) costs average $0.30–$0.80/m³ of treated wastewater (MOECC 2024).
What are the discharge limits for Ontario sewage treatment plants?
MOECC (2023) discharge limits for municipal sewage treatment plants in Ontario typically mandate BOD and TSS concentrations of 25 mg/L. Phosphorus limits are often 0.5 mg/L, particularly strict in sensitive areas like the Lake Simcoe watershed. E. coli limits are generally 200 CFU/100 mL.
How can Ontario plants reduce energy consumption?
Ontario plants can significantly reduce energy consumption through several proven strategies. Upgrading to high-efficiency blowers can yield up to 30% savings in aeration, which is the largest energy consumer. Installing variable frequency drives (VFDs) on pumps and motors can save approximately 20%. Implementing AI-driven aeration control systems, which optimize dissolved oxygen levels in real-time, can further reduce energy usage by 15%.