How to choose MBR or activated sludge for a Kennett petroleum facility
MBR is usually the stronger choice for petroleum wastewater in Kennett when reuse is required, solids carryover must stay consistently low, footprint is constrained, or recurring FOG and emulsified-oil surges make clarifier settling unreliable. Conventional activated sludge can be more economical for stable, discharge-only duty with useful existing aeration and clarifier assets. Supplied refinery planning references report MBR SRT of 20–60 days and COD below 50 mg/L versus CAS SRT of 5–15 days and COD of 60–100 mg/L, but these are not Kennett limits. Both systems require controlled oil, grease, suspended material, pH, and equalization before biological treatment.
The comparison is not simply membrane versus activated sludge. MBR and conventional activated sludge refinery wastewater processes use the same core biological mechanism: aerated microorganisms oxidize dissolved organics, with nitrification possible when process conditions support it. MBR retains biomass in the reactor and separates solids with submerged membranes; CAS depends on secondary-clarifier settling.
Select MBR when the treated-water destination requires firm reuse, low solids carryover, or a compact installation. Retain CAS when loading is stable, discharge-only service is credible, and existing aeration and clarifier assets have useful remaining life. Neither technology automatically establishes compliance: verify the current permit, sewer limitations, receiving-water constraints, and reuse criteria before selecting equipment.
Begin with a segregated 12-month wastewater dataset rather than a blended plant average. The MBR wastewater membrane bioreactor cost per m³ framework also shows why the decision must proceed from measured loads and required water quality to vendor guarantees.
Characterize each petroleum wastewater stream before selecting equipment
Petroleum streams must be characterized separately because their contaminant concentrations, temperatures, and operating patterns can imply different treatment and disposal routes. Track produced water, desalter brine, tank-bottom draws, spent caustic, wash water, and stormwater runoff independently. A plant-wide average can conceal slug loads, salinity, toxicity, and oil fractions that determine biological loading and membrane protection.
Request flow, temperature, COD, BOD, TSS, free and emulsified oil, FOG, phenols, PAHs, sulfides, ammonia, pH, conductivity, and salinity data. Specify the averaging periods and operating conditions used to establish sustained and peak design bases.
| Input or pathway | Why it affects equipment selection |
|---|---|
| Source-by-source flow and temperature | Defines equalization, biological loading, cooling, and hydraulic requirements. |
| Oil, FOG, suspended solids, and surfactants | Determines pretreatment and membrane-fouling or clarifier-settling risk. |
| COD, BOD, phenols, PAHs, and ammonia | Sets biological capacity and the need for nitrification assessment. |
| pH, conductivity, and salinity | Identifies chemical-preparation, inhibition, and downstream-polishing issues. |
| Final destination | Determines discharge, reuse, or zero-liquid-discharge polishing requirements. |
The supplied HydropureWater comparison, published in 2026, uses London, Ohio refinery planning values: streams at 30–70 °C, free or emulsified oil often at 50–500 mg/L, phenols at 10–100 mg/L, and ammonia at 20–80 mg/L. The source explicitly identifies these as planning references, not Kennett limits.
Confirm whether the destination is surface-water discharge, groundwater injection, sanitary sewer, process reuse, cooling-tower makeup, boiler feed, or pretreatment for zero-liquid-discharge. That decision determines the required biological endpoint, solids-removal performance, and polishing scope. Where oil and FOG measurements support it, evaluate a DAF oil and FOG pretreatment system before biological treatment.
Compare biological treatment and solids separation
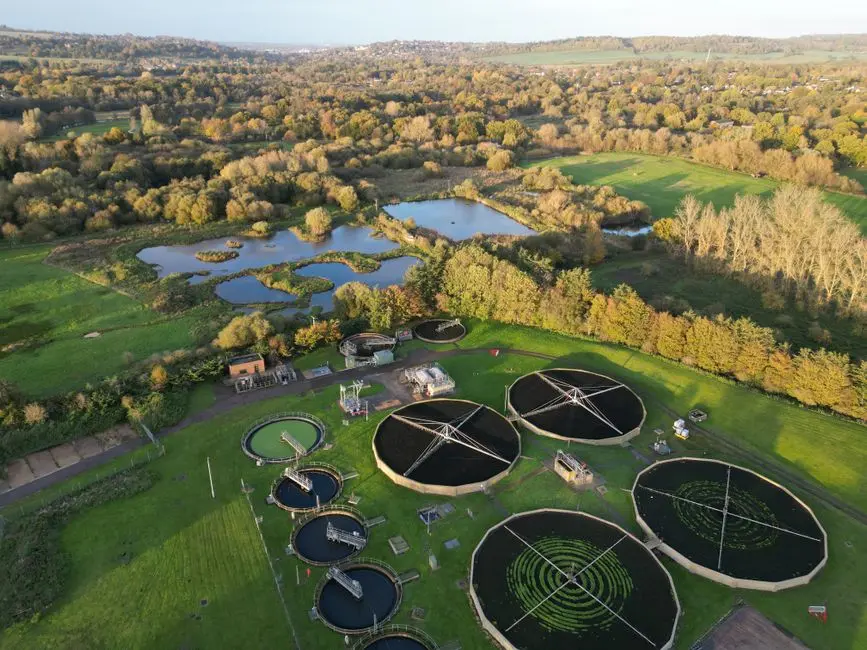
MBR removes solids without relying on the settling behavior that governs CAS performance. Both processes use an aerated biological basin where heterotrophic microorganisms oxidize dissolved organics; nitrifiers can convert ammonia to nitrate when the selected temperature, SRT, loading, alkalinity, and other process conditions support nitrification.
CAS requires biomass to form settleable floc. Petroleum FOG or surfactant surges can impair settling, promote filamentous bulking, and wash solids from the secondary clarifier. A bulking event can increase effluent solids, destabilize sludge wasting, and transfer risk to downstream polishing or discharge limits.
MBR retains biomass inside the reactor and uses a physical membrane barrier to separate suspended solids. It therefore does not depend on settleable floc for the same solids-capture duty. An integrated submerged-PVDF MBR system can therefore be more suitable when stable oil and solids control matters or the available footprint is restricted.
The membrane barrier is not a substitute for biological treatment or upstream oil control. Biological degradation performs most dissolved-organic and nitrogen removal, while the membrane controls separation. Uncontrolled free oil, grease, incompatible chemicals, excessive suspended material, or unsuitable pH can overload the biology and foul or damage membranes.
Low suspended solids also does not establish reuse readiness. Dissolved salts, silica, hardness, residual oxidant, and scaling constituents require separate evaluation against the intended process, cooling, boiler, or disposal destination. Reuse polishing remains a separate engineering step.
Compare process parameters and planning performance
The supplied refinery comparison separates screening values from guaranteed Kennett design values. The 2023 Membranes review cited by HydropureWater reports longer MBR sludge retention time and lower suspended-solids effluent than the CAS reference, but final sizing must follow verified site flow, temperature, loading, pretreatment, and regulatory criteria.
| Parameter | MBR screening reference | CAS screening reference |
|---|---|---|
| Sludge retention time | 20–60 days | 5–15 days |
| Hydraulic retention time | 4–8 hours | 6–12 hours |
| Effluent COD | Below 50 mg/L | 60–100 mg/L |
| Effluent TSS | Below 5 mg/L | 20–30 mg/L |
| Effluent oil and grease | Below 2 mg/L | Not supplied in the comparison |
These values come from the 2023 Membranes review as cited in the supplied HydropureWater comparison, published in 2026. They are refinery planning references, not Kennett permit limits, reuse specifications, or bidder guarantees.
MBR sludge retention time provides a longer biological treatment window for complex or recalcitrant organics, while membrane retention protects the solids inventory from dependence on clarifier settling. The planning values should not be transferred directly into an equipment specification.
For CAS, require bidders to explain how the proposed SRT and HRT accommodate the petroleum loading basis and what controls will mitigate secondary clarifier bulking. For MBR, require the selected SRT, HRT, membrane area, design flux, and scour-air calculation to be tied to the same influent basis.
The comparison excerpt supplies no CAS oil-and-grease value. Require each bidder to state its guaranteed oil-and-grease basis, sampling method, averaging period, and compliance consequence. Any final performance guarantee must follow the verified design flow, temperature, loading basis, pretreatment performance, and current Kennett requirements.
Account for footprint, operating burden, and pretreatment
MBR can reduce the footprint because the secondary clarifier is eliminated, but the claimed saving is not a substitute for site planning. The HydropureWater verified product catalog states that its integrated MBR system has a 60% smaller footprint than conventional systems. Treat that as a catalog claim, not a guaranteed Kennett layout, and request a scaled plan showing equalization, pretreatment, biological tanks, blowers, controls, CIP equipment, maintenance access, and future expansion.
| Issue | MBR obligations | CAS obligations |
|---|---|---|
| Solids separation | Membrane modules, transmembrane-pressure monitoring, and membrane replacement planning | Secondary clarifiers, sludge wasting, scum removal, and settleable-floc management |
| Mechanical reliability | Scour-air reliability, blowers, controls, and clean-in-place provisions | Aeration, sludge pumping, wasting equipment, and clarifier-scum systems |
| Operational risk | Fouling, cleaning chemistry, membrane availability, and module replacement | Filamentous bulking, solids washout, sludge inventory, and clarifier upset |
| Upstream protection | Oil, FOG, suspended solids, chemicals, and pH control | Oil, FOG, suspended solids, chemicals, and pH control |
The supplied planning references state that membrane CIP is performed every 6–12 months and give membrane life of 5–8 years. These are non-guaranteed planning references from the 2026 HydropureWater comparison, not operating commitments for petroleum duty. A supplier should state expected cleaning frequency under the proposed loading, chemical consumption, replacement intervals, and spare-module strategy.
DAF oil and FOG pretreatment may be appropriate where measured wastewater supports it. Neither a clarifier nor a membrane can compensate for uncontrolled free oil, grease, emulsified oil, surfactants, incompatible chemicals, slug loads, or unsuitable pH. Verify pretreatment performance with the same oily wastewater expected at the plant.
Build a lifecycle cost comparison for Kennett
MBR generally carries higher mechanical and operating demands than CAS, so equipment price alone will not determine lifecycle cost. The supplied 2026 HydropureWater refinery planning references provide directional allowances rather than Kennett quotations.
| Cost item | Supplied screening reference | Kennett procurement treatment |
|---|---|---|
| New-build MBR CAPEX | $2.0 million–$8.5 million for 50–500 m³/day | Obtain a site-specific quotation with identical scope to CAS. |
| New-build CAS CAPEX | $1.2 million–$4.5 million for 50–500 m³/day | Confirm whether existing civil assets reduce the required scope. |
| Indicative MBR OPEX | $0.40–$0.75/m³ | Rebuild from vendor consumption and local prices. |
| MBR operating-cost premium | Estimated 20–30% above CAS | Test against energy, chemical, labor, and replacement assumptions. |
| Scour-air energy | Approximately 0.7–1.4 kWh/m³ and 0.8–1.5 kWh/m³ in two refinery references | Require reconciliation with guaranteed flow and equipment configuration. |
Build the lifecycle model from electricity price, chemical consumption, membrane replacement, labor, sludge disposal, water purchase, sewer charges, recovered-water value, avoided clarifier upsets, downstream polishing, redundancy, and spare-parts strategy. The industrial wastewater operating-cost breakdown provides the structure for making those assumptions visible.
The supplied London scenario describes $200,000–$400,000 per year in avoided fresh-water and sewer costs for a refinery reusing treated effluent. Do not transfer that value to Kennett without verified local prices and firm reuse demand. Model recovered water only where the destination, quantity, quality, and operating schedule are documented.
Require bidders to price pretreatment, equalization, biological tanks, blowers, pumps, controls, electrical and civil work, commissioning, training, performance testing, membrane replacement, and downstream polishing. Without matched scopes, neither the CAPEX ranges nor the OPEX estimate supports a valid award.
Match the treatment train to the discharge or reuse pathway
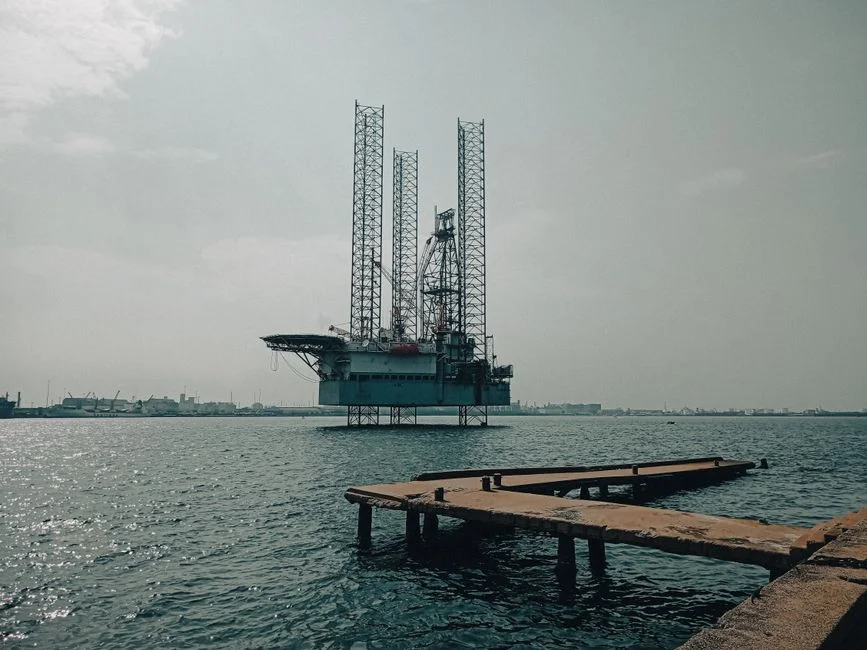
The destination of the treated water should determine the treatment train. A membrane bioreactor petroleum wastewater system may improve solids separation, but it does not replace oil recovery, equalization, biological treatment, or reuse-specific polishing.
| Scenario | Technical path to evaluate | Decision gate |
|---|---|---|
| Firm process, cooling-tower, or boiler-feed reuse | MBR with reuse-specific polishing where needed | Validate conductivity, silica, hardness, residual oxidant, and scaling against actual site water and final-user requirements. |
| Stable discharge-only duty | Retained CAS with useful existing aeration and clarifier assets | Verify current requirements, clarifier condition, loading stability, sludge handling, and lifecycle cost. |
| Existing CAS with future reuse target | CAS biology with polishing or membrane separation | Complete an integration study covering hydraulics, controls, footprint, redundancy, and bypass provisions. |
| Recurrent FOG or emulsified-oil surges | Enhanced pretreatment followed by MBR or CAS | Require source characterization, equalization performance, and oil-recovery evidence. |
| Groundwater injection or sensitive receiving context | Defer final technology selection | Verify current authorization, limits, aquifer constraints, and monitoring requirements. |
For high-salinity streams, evaluate reuse and disposal constraints separately from the biological selection. The high-salinity wastewater RO treatment guide is relevant where reverse osmosis is part of the final train, but it does not replace pretreatment or establish the permitted discharge pathway.
For any reuse scenario, validate polishing with actual site-water chemistry and the intended downstream equipment. A low-TSS biological effluent may still require treatment for dissolved constituents or scaling. Conversely, CAS can remain viable where its existing assets, stable loading, and required effluent quality support the service.
Issue a petroleum-wastewater treatment procurement package
A bid-ready package should expose every assumption behind equipment sizing and performance. Require a signed process basis identifying wastewater sources, flow range, temperature, oil and grease, COD, BOD, TSS, phenols, PAHs, sulfides, ammonia, pH, conductivity, and salinity. Include analytical records and the averaging periods used to establish peak and sustained design conditions.
Require each bidder to state the guaranteed design flow, influent limits, SRT, HRT, membrane material and pore size, design flux, scour-air demand, cleaning chemistry, redundancy, controls, maintenance obligations, and expected replacement intervals. These are essential checks when comparing an MBR against CAS because they expose whether the quoted process has been engineered for the petroleum basis.
| Bid deliverable | Minimum information required |
|---|---|
| Design basis | Sources, flow, temperature, loads, water chemistry, averaging periods, and destination. |
| Process calculations | SRT, HRT, biological loading, equalization, membrane area, design flux, aeration, and scour air. |
| Equipment drawings | Hydraulic profile, membrane arrangement, blowers, pumps, pretreatment, controls, CIP, and redundancy. |
| Operations | Control narratives, maintenance plan, operator training, commissioning, and performance testing. |
| Commercial | Complete scope, exclusions, membrane replacement pricing, spares, support, and acceptance criteria. |
Clarify whether pricing includes pretreatment, equalization, biological tanks, blowers, pumps, controls, electrical work, civil work, commissioning, operator training, and performance testing. Require a complete-plant price because skid or module prices are not directly comparable.
Distinguish integrated MBR skid capacity from individual DF Series module output. The HydropureWater verified catalog lists 0.1 μm PVDF configurations of 80–225 m² producing 32–135 m³/day. A module listing is not complete plant capacity: the bidder must demonstrate biological capacity, pretreatment, equalization, hydraulic capacity, controls, and redundancy.
The Kennett regulatory gate remains open until the buyer obtains the current discharge authorization or reuse criteria and verifies the intended destination. No technology label replaces that verification.
Frequently Asked Questions
What does MBR cost compared with conventional activated sludge for a Kennett petroleum project?
The supplied 2026 refinery planning references give new-build MBR CAPEX of $2.0 million–$8.5 million and CAS CAPEX of $1.2 million–$4.5 million for 50–500 m³/day. Indicative MBR OPEX is $0.40–$0.75/m³, with MBR operating cost estimated at 20–30% above CAS. These are not Kennett quotations. Request matched bids using the same verified flow, pretreatment, civil, controls, commissioning, and polishing scope, then rebuild operating cost using local electricity, chemical, labor, sludge-disposal, and reuse-value inputs.
How should an engineer size an MBR or CAS system?
Size from the segregated flow, temperature, and contaminant dataset—not a blended average or individual module output. The bidder must document SRT, HRT, biological loading, membrane area and design flux, aeration and scour air, equalization, pretreatment, and redundancy. The DF Series catalog output of 32–135 m³/day for specified 0.1 μm PVDF configurations describes modules, not complete plant capacity.
What should a supplier provide before being selected?
Require a signed design basis, guaranteed flow and influent limits, SRT and HRT, membrane material and pore size, design flux, scour-air demand, CIP chemistry, drawings, hydraulic calculations, controls narrative, redundancy, maintenance schedule, replacement intervals, complete-plant pricing, commissioning, training, and performance testing. Check that all bidders are pricing the same petroleum treatment train and destination.
Does MBR automatically satisfy Kennett wastewater requirements?
No. MBR or CAS does not automatically establish compliance. Verify the current permit, sewer limitations, receiving-water constraints, groundwater authorization where applicable, and firm reuse criteria. Then compare bidder guarantees with those requirements, including the oil-and-grease basis and sampling method, which the supplied CAS comparison does not provide.
Related Equipment
- DAF oil and FOG pretreatment system — specifications, capacity range, and technical data