Breaking Down Operating Costs Across Five OPEX Pillars
Industrial wastewater treatment operating costs typically split across energy (25-40%), chemicals (15-30%), labor (20-35%), sludge disposal (10-25%), and maintenance (5-15%) for plants treating 50,000-500,000 gallons per day. Energy is usually the largest controllable line. Total OPEX often falls between $0.25 and $1.00 per cubic meter for secondary biological treatment.
Ask any plant manager for wastewater treatment costs, and the answer is often incomplete. Most sites can quote chemical spend and the electricity bill. True operating expenditure still includes sludge hauling, spare parts, overtime, and items charged to other budgets.
Breaking down operating costs into these five pillars gives manufacturers a decision map for new builds, upgrades, or outsourced operations. Shares shift with technology, influent strength, and discharge limits, but the categories below cover typical industrial facilities in that flow band.
| Cost Category | Typical Share of Total OPEX | Key Drivers |
|---|---|---|
| Energy | 25-40% | Aeration, pumping, mixing, UV/ozone |
| Chemicals | 15-30% | Coagulants, flocculants, pH adjustment, disinfection |
| Labor | 20-35% | Operators, maintenance staff, lab technicians |
| Sludge Disposal | 10-25% | Dewatering, hauling, landfill/incineration fees |
| Maintenance & Parts | 5-15% | Preventive maintenance, spare parts, membrane replacement |
Energy Costs: The Largest Controllable Expense
Energy typically represents the single largest operating cost and the fastest lever for savings. Aeration alone accounts for 50-65% of total energy use in activated sludge processes, so blower and dissolved oxygen (DO) control deserve first attention.
Aeration Energy
Biological treatment needs oxygen so microbes can oxidize organic pollutants. In conventional activated sludge, blowers push air through basin diffusers. Demand rises with organic loading, diffuser condition, DO setpoint, and blower type.
- Organic loading (BOD/COD): Higher influent strength requires more oxygen and thus more energy.
- Diffuser efficiency: Fine bubble diffusers deliver 2-4 kg O2/kWh versus 1-2 kg O2/kWh for coarse bubble. Fouled diffusers lose 15-30% efficiency over time.
- Dissolved oxygen (DO) setpoint: Many plants run at DO levels of 3-4 mg/L when 1.5-2.0 mg/L is sufficient. Reducing DO by 1 mg/L can save 10-15% of aeration energy.
- Blower type: High-speed turbo blowers are 20-35% more efficient than traditional positive displacement blowers.
According to US EPA training materials (2021), tight automated DO control can save a WWTP between 10% and 30% of total energy costs. Reactor DO above 2.0 mg/L usually signals wasted air. Operating at 4 mg/L instead of 2 mg/L cuts oxygen transfer rate by about 35% under the same conditions (EPA, 2021).
A typical industrial activated sludge plant treating moderate-strength wastewater (BOD 300-500 mg/L) consumes 0.3-0.8 kWh per cubic meter for aeration alone. At US industrial electricity rates of $0.08-$0.12/kWh, that equals $0.024-$0.096 per cubic meter just for aeration. EPA also cites about 1,800 kWh per million gallons for conventional activated sludge and 2,700 kWh per million gallons for oxidation-ditch plants as typical total process energy intensities (EPA, 2021).
How do you estimate pumping energy costs?
Pumping energy for lift and transfer duties is estimated from flow, total dynamic head, pump efficiency, and annual run hours. Influent, return activated sludge (RAS), internal recycle, and effluent pumps together often take 15-25% of plant electricity. Oversized pumps held at full speed behind throttled valves waste power every hour they run. Variable frequency drives (VFDs) on major pumps can cut pumping energy by 30-50% when flow swings with production.
Most plants we size for industrial lift and transfer duty run near the lower end of that savings band until operators trim setpoints and confirm wet-well levels. Mine-water and remote transfer systems follow the same power equation; long static lifts simply raise head and kWh per cubic meter.
Auxiliary Energy Consumers
Mixers, scrapers, UV disinfection, dissolved air flotation (DAF) systems, and building HVAC add to the bill. Individually small, they can still total 10-20% of plant energy when left unchecked.
Chemical Costs: Where Small Changes Yield Big Savings
Chemical spend is often the second-largest OPEX line and tracks influent quality, process choice, and dosing discipline. The main buckets are coagulants and flocculants, pH adjustment, disinfection, and nutrient-removal chemicals.
Coagulants and Flocculants
Ferric chloride, aluminum sulfate (alum), polyaluminum chloride (PAC), and organic polymers serve primary clarification, DAF, and sludge dewatering. Coagulation-flocculation chemical costs typically range from $0.02-$0.10 per cubic meter depending on influent TSS and oil/grease.
Jar testing at least monthly, plus automated chemical dosing systems with streaming current or turbidity feedback, keeps dose on target. Over-dosing coagulant by just 10% can add $10,000-$50,000 per year at a mid-sized plant and raise sludge mass at the same time.
pH Adjustment
Sodium hydroxide, lime, sulfuric acid, and hydrochloric acid hold biological pH in the usual 6.5-8.5 band. Plants with swingy influent pH often spend $0.01-$0.05 per cubic meter on these reagents.
Disinfection
Sodium hypochlorite, chlorine dioxide, UV, and ozone carry different capital and operating profiles. Hypochlorite is cheap to install but costly at high flow. UV costs more upfront and less to run. Choice follows flow, contact time, and byproduct limits in the permit.
Nutrient Removal Chemicals
When biological phosphorus removal cannot meet the limit, ferric or alum precipitation adds about $0.01-$0.04 per cubic meter. Supplemental carbon for denitrification (methanol, glycerol, acetic acid) can cost $0.02-$0.08 per cubic meter under typical industrial loads.
Labor Costs: The Human Factor
Labor is hard to trim because staffing tracks regulation, process complexity, and local wage markets. Automation reduces walk-downs, not the need for skilled coverage.
Staffing Benchmarks
Typical staffing levels for industrial wastewater treatment plants:
| Plant Capacity (GPD) | Treatment Complexity | Typical FTEs |
|---|---|---|
| Under 50,000 | Simple (screening, settling, disinfection) | 0.5-1 |
| 50,000-200,000 | Moderate (activated sludge, DAF) | 1-3 |
| 200,000-500,000 | Complex (MBR, nutrient removal) | 3-5 |
| 500,000-2,000,000 | Advanced (multiple treatment trains) | 5-12 |
Fully burdened labor costs (salary, benefits, training, PPE, workers' comp) in the US range from $55,000-$95,000 per FTE for operators and $80,000-$130,000 for maintenance technicians, depending on region and certification level.
Labor Optimization Strategies
SCADA with remote monitoring, automated dosing, and alarm management lets one operator cover work that once needed two. Capital for that automation typically pays back in 2-4 years through lower labor hours and steadier process control.
Sludge Disposal: The Hidden Cost Multiplier
Sludge management is often the most underestimated line. Every kilogram of pollutant pulled from the water lands in solids that must be thickened, dewatered, and hauled.
Dewatering Costs
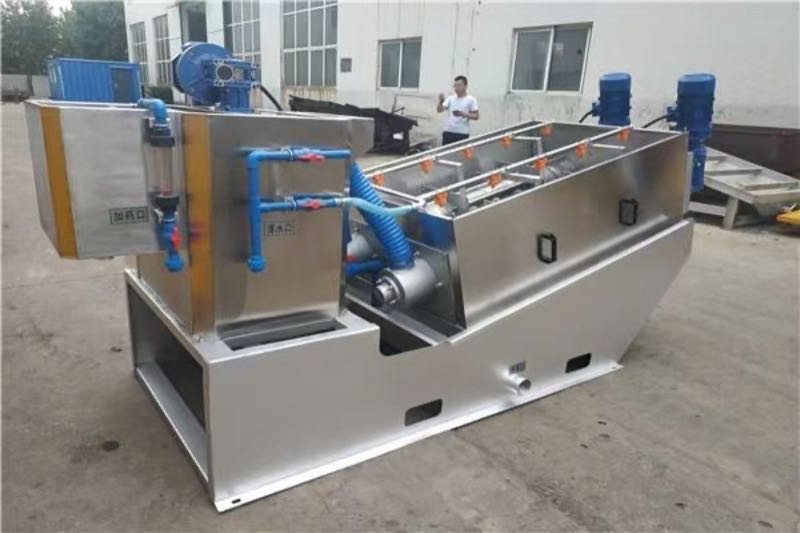
Mechanical dewatering with plate and frame filter presses, belt presses, or centrifuges cuts sludge volume by 80-95%. A filter press can produce cake solids of 25-40%, compared with 15-22% for belt presses and 18-28% for centrifuges. Drier cake means fewer wet tons on the truck.
Filter press operating costs (energy, cloth, polymer) typically run $15-$30 per dry ton of solids. Belt presses cost $10-$25 per dry ton but leave wetter cake. Total cost including disposal can range from $80-$300 per wet ton depending on local outlets.
Disposal Options and Costs
Landfill disposal of dewatered sludge costs $40-$120 per wet ton in the US, depending on region and classification. Land application (if permitted) costs $20-$60 per wet ton. Incineration costs $80-$200 per wet ton and may be required when metals or other contaminants rule out land use.
Sludge disposal cost scales with sludge production, which tracks treatment technology and chemical dose. Over-dosing coagulant wastes reagent dollars and can raise sludge production by 20-40%, compounding hauling fees.
Maintenance and Parts: Penny-Wise, Pound-Foolish
Maintenance is usually the smallest budget line, yet deferred work is the fastest path to emergency CAPEX. A planned blower bearing job costs $2,000-$5,000; an unplanned failure with rush procurement costs $20,000-$50,000 plus downtime.
Preventive vs. Reactive Maintenance
Industry practice consistently shows that every dollar spent on preventive maintenance saves $3-$5 in reactive work. Best-practice plants target a preventive-to-reactive ratio of 80:20 or better. That needs a CMMS, written PM schedules, and disciplined execution.
Membrane Replacement Costs
For MBR plants, membrane replacement is a large periodic bill. MBR membranes typically last 7-10 years with proper cleaning and cost $30-$80 per square meter to replace. For a 200,000 GPD MBR plant, total membrane replacement might run $100,000-$300,000. Cleaning protocols that extend life by 2-3 years avoid a large share of that spend.
What drives RO plant operating costs?
RO plant operating costs are driven by high-pressure pumping electricity, antiscalant and cleaning chemicals, cartridge filter changeouts, and scheduled membrane replacement—not by labor alone. A 20 m³/hr industrial RO train still follows that same cost stack. Power scales with recovery and feed TDS. Chemicals scale with scaling risk. Membrane modules are a multi-year refresh, planned like the MBR replacement ranges above.
Annual maintenance should book membrane CIP chemicals, instrument calibration, and pump seal kits before the first year closes. Plants that skip those line items understate true cost per cubic meter of permeate.
Benchmarking: What Should Your Plant Cost?
Total operating cost per cubic meter treated is the cleanest benchmark across sites. Typical ranges for industrial wastewater treatment:
| Treatment Level | Cost per Cubic Meter (USD) |
|---|---|
| Primary treatment only (screening, settling) | $0.10-$0.30 |
| Secondary biological treatment (activated sludge) | $0.25-$0.60 |
| Advanced treatment (MBR, nutrient removal) | $0.40-$1.00 |
| Tertiary/reuse quality | $0.60-$1.50 |
If your costs sit well above these bands, focused work on energy, chemicals, and sludge disposal can typically cut OPEX by 15-30% within 6-12 months.
Why set effluent targets below discharge limits?
Plants set effluent targets below current discharge standards when reuse, surcharge fees, or upcoming consent limits are already on the roadmap. Meeting today's permit on average days can look easy, yet peak COD or nutrients still trip the meter. Holding a buffer raises both investment and operating costs unless reuse credit or avoided surcharges pay for the tighter train.
Most plants we size for reuse polishing accept that extra OPEX only after a written reuse or compliance case. Without that case, design for the permit and keep the upgrade path modular.
Can digital twins cut wastewater energy use?
Digital twins cut wastewater energy use when live DO, airflow, and influent load feed the model and setpoints write back to SCADA. Full-scale utility programs report energy optimisation, emissions-aware aeration, and automatic model updates as the practical gains. First-year pilots almost always start on the aeration train, because blowers dominate kWh.
Top 10 Cost Reduction Strategies
- Install DO control on aeration systems (5-15% energy savings)
- Add VFDs to all major pumps (20-40% pumping energy savings)
- Implement automated chemical dosing with feedback control (10-25% chemical savings)
- Optimize sludge age to minimize excess sludge production
- Perform monthly jar testing to verify coagulant dosing
- Upgrade to high-efficiency turbo blowers at end of life
- Negotiate bulk chemical contracts with price caps
- Maximize dewatering performance to reduce disposal volume
- Implement a preventive maintenance program (CMMS)
- Consider DAF pretreatment to reduce biological loading and energy costs
Who this is for: Plant engineers, EPC teams, and procurement managers who need a clear OPEX map before CAPEX decisions. Who should look elsewhere: Sites seeking only municipal rate studies without industrial influent data. Next step: Bring your flow, BOD/COD, and sludge disposal invoices, then request a scoped operating-cost review with HydropureWater process engineers.
Frequently Asked Questions
What is the typical cost per cubic meter for industrial wastewater treatment?
Total operating costs typically range from $0.25-$1.00 per cubic meter for secondary biological treatment, depending on influent strength, discharge requirements, plant size, and local energy, chemical, and sludge prices. Advanced treatment with MBR or tertiary polishing can push costs to $0.60-$1.50 per cubic meter. The fastest cuts usually come from aeration energy, chemical dosing, and sludge disposal volume.
Which is more expensive to operate: activated sludge or MBR?
MBR systems typically cost 20-40% more to operate than conventional activated sludge because of membrane aeration and periodic membrane replacement. MBR plants also produce higher-quality effluent in a smaller footprint and may avoid a separate tertiary step. When both paths must hit the same effluent quality, MBR often competes with conventional treatment plus tertiary polishing on total cost of ownership.
How much can automation reduce wastewater treatment operating costs?
Comprehensive automation—DO-controlled aeration, automated chemical dosing, SCADA monitoring, and predictive maintenance—can reduce total OPEX by 15-30%. The largest slices usually come from energy (DO control) and chemicals (closed-loop dosing). Labor savings from fewer manual rounds can trim labor cost another 10-20%, with typical automation payback in 2-4 years.
What percentage of operating costs should go to maintenance?
Best-practice facilities allocate 3-5% of total asset replacement value annually for maintenance, or roughly 8-15% of the operating budget. Spending below that band correlates with more unplanned downtime, emergency repairs, and shorter equipment life. A funded preventive program remains one of the highest-return operating investments on a treatment plant.