
Which treatment is better for chemical wastewater in Florence?
For chemical wastewater in Florence, MBR is usually the better fit when the plant needs compact equipment, high solids separation, reliable reuse potential, or protection from biological solids carryover. CAS is often more economical when wastewater is biodegradable, land is available, and discharge to the municipal sewer is permitted. MBR generally costs more to operate: the related industrial guide reports 0.4–0.8 kWh/m³ for MBR versus 0.2–0.4 kWh/m³ for CAS. Neither system removes dissolved chemical contaminants automatically; equalization, pH control, toxicity assessment, and compound-specific pretreatment may determine feasibility.
The decision should be based on the wastewater, not on a generic effluent comparison. CAS can be adequate for a permitted, readily biodegradable discharge when land is available. MBR is generally stronger for land-constrained sites, reuse applications, or stringent solids separation. The EPA membrane-bioreactor fact sheet describes MBR as a technology with distinct applicability, design features, and operating considerations; it does not establish that MBR is suitable for every chemical wastewater.
MBR retains biomass and separates suspended solids through membranes, but it does not inherently remove every dissolved chemical constituent. CAS also depends on a viable biological population. Florence siting and discharge conditions therefore belong in the design basis, without assuming unverified local sewer limits or permit requirements.
Start with the chemical wastewater characterization
Chemical wastewater should be characterized by production cycle before either process is sized. A single composite sample can conceal the pH shifts, toxicity spikes, salinity changes, and intermittent dump flows that decide whether biology can remain stable.
Request time-based sampling across normal production, cleaning, and dump cycles. The data package should identify pH, temperature, salinity, COD/BOD, TSS, toxicity, and the specific chemical families present. It should also distinguish readily biodegradable organics from refractory or inhibitory compounds. Both CAS and MBR depend on a viable biological population, so a favorable bulk COD value does not establish biological treatability.
Evaluate chemical compatibility with membrane housings, seals, gaskets, cleaning chemicals, coagulants, and polymer additives using manufacturer documentation. A bidder should identify equalization, pH adjustment, toxicity control, and compound-specific pretreatment rather than implying that the selected bioreactor removes dissolved contaminants. An automatic chemical dosing system may support pH or coagulation control, but the bid must provide dose-response evidence and compatibility confirmation.
Any project-specific CAS or MBR sizing remains provisional until representative influent and discharge data are available.
| Bid data | Why it matters | Decision consequence |
|---|---|---|
| Time-based pH, temperature, salinity, COD/BOD and TSS | Defines biological loading and equalization requirements | Confirms whether the feed can support a stable biological process |
| Chemical identity and biological toxicity assessment | Separates biodegradable material from inhibitory or refractory compounds | Determines whether pretreatment, source control, or a pilot is required |
| Production, cleaning and dump-cycle flow profile | Reveals hydraulic surges and concentrated waste streams | Sets equalization and peak-treatment duties |
| Membrane, seal, gasket and cleaning-chemical compatibility list | Identifies materials exposed to the wastewater and treatment chemicals | Rules out equipment configurations that cannot be defended |
How biological treatment and membrane separation work differently
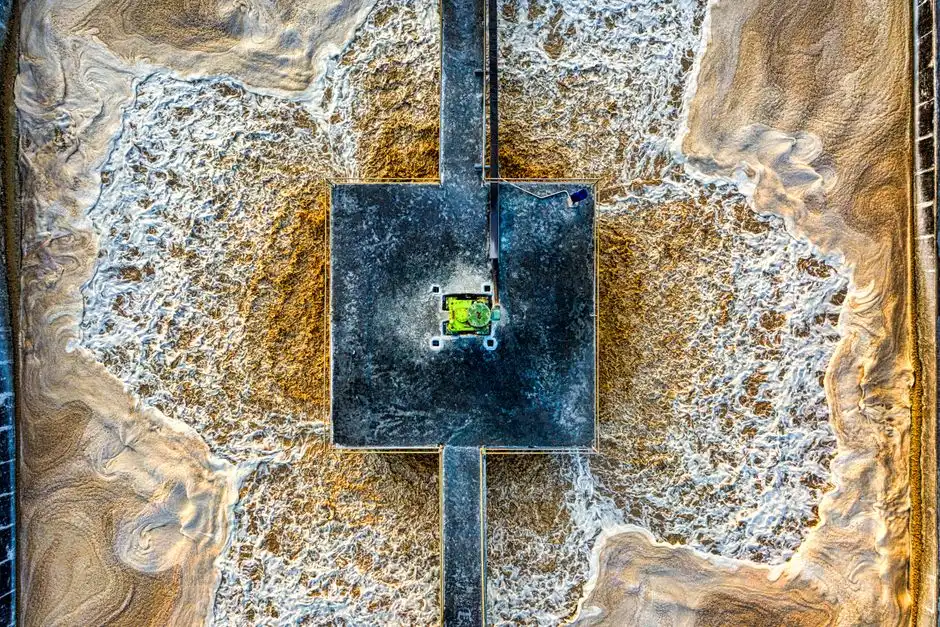
CAS uses a biological reactor followed by gravity settling, while MBR couples activated-sludge biology with submerged membrane separation. The distinction is physical solids separation, not a guarantee that dissolved contaminants have been destroyed or removed.
In CAS, microorganisms consume biodegradable organics in an aerated reactor. A clarifier then separates biomass from the treated liquid, so effluent quality depends on settling and sludge carryover. MBR retains biomass in the reactor and uses membranes to capture suspended solids and colloids. An integrated MBR wastewater treatment system combines activated-sludge treatment with submerged PVDF membrane filtration.
The aerobic granular sludge–MBR review reports organic matter removal near 95% as COD, TOC removal of 84.7–91.9%, and total-nitrogen removal of 41.7–78.4% for continuous-fed AGS–MBR (Aerobiotic Granular Sludge–Membrane BioReactor review, 2021). These results show why biological removal must be assessed separately from solids separation. Membrane filtration can provide a strong physical barrier while specific dissolved compounds remain governed by biodegradation, inhibition, or upstream treatment.
MBR does not remove a compound merely because it passes through a membrane or because the membrane retains biomass. Compound-specific fate data, toxicity assessment, and reuse or discharge objectives remain necessary.
Pretreatment gates that determine MBR feasibility
Equalization is the first feasibility gate because untreated chemical wastewater can vary faster than the biology can accommodate. The selected process must demonstrate performance under the documented production, cleaning, and dump-cycle surge profile.
Oil, grease, suspended solids, and particulate contaminants can load separators and membranes. DAF pretreatment for chemical wastewater is an optional upstream stage when characterization identifies removable FOG, oil, TSS, or colloidal matter. It should not be included as a generic accessory: the design basis must show which contaminants it will remove and what residual load reaches the biological process.
Chemical dosing may be needed for pH adjustment or coagulation, but compatibility testing and dose-response data are required. The final pretreatment selection must reflect the actual constituents, membrane material, biological toxicity results, and reuse or discharge objectives.
| Gate | Evidence required | Procurement consequence |
|---|---|---|
| Flow and concentration equalization | Cycle-based flow, pH, salinity, COD/BOD and toxicity profile | Define buffer volume, mixing, pumping, and demonstrated surge performance |
| Oil, solids and colloidal load | Measured TSS, FOG/oil, particle characteristics and settleability | Determine whether DAF or another pretreatment stage is justified |
| pH and chemical control | Target range, reagent list, dose-response data and downstream compatibility | Define dosing equipment and treatment reserve |
| Biological inhibition | Compound-specific toxicity assessment and biological response data | Establish source control, compound-specific treatment, or pilot requirements |
| Membrane protection | Manufacturer compatibility matrix and cleaning protocol | Reject unsupported material or chemical combinations |
MBR versus CAS for chemical wastewater
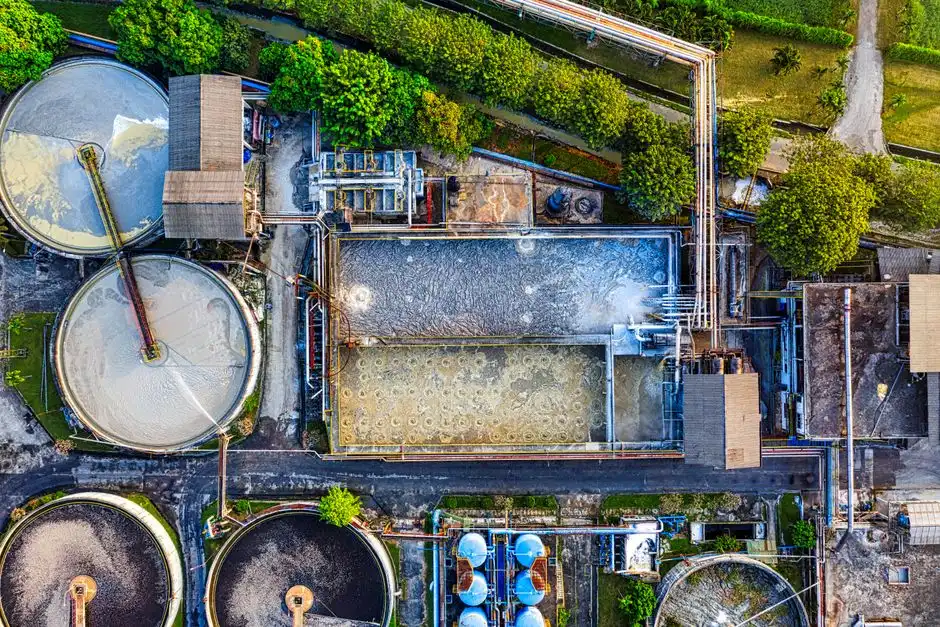
MBR trades greater operating complexity for stronger solids separation and a smaller biological train, while CAS usually remains the lower-complexity option when land, influent stability, and discharge conditions are favorable.
| Criterion | MBR | CAS | Evidence and qualification |
|---|---|---|---|
| Solids separation | Membrane barrier captures suspended solids and colloids | Clarifier settling governs solids carryover | Physical separation quality must be distinguished from dissolved-contaminant removal |
| Biological retention | Biomass is retained within the membrane bioreactor | Biomass settles in the secondary clarifier | Both depend on viable biology |
| Footprint | 60% smaller than conventional systems in the verified product catalog | Requires separate biological and clarification functions | HydropureWater verified catalog; not a Florence site measurement |
| Energy | 0.4–0.8 kWh/m³ | 0.2–0.4 kWh/m³ | Related industrial guide, 2026; comparison ranges, not guaranteed project consumption |
| Waste activated sludge | 10–30% less than CAS | Baseline | Related industrial guide, 2026; food-and-beverage scope, not a chemical-plant guarantee |
| Effluent comparison | Below 1 mg/L TSS and 5 mg/L BOD | Typically 10–30 mg/L TSS and 50–100 mg/L during surges | Related industrial guide, 2026; food-and-beverage scope, not measured Florence chemical-plant performance |
| Fouling control | Requires aeration, backwash, monitoring, and chemical-cleaning controls | Less membrane-specific fouling management | AGS–MBR review, 2021: filtration periods of 78 and 61 days without physical cleaning in cited examples |
| TMP evidence | 3–6 kPa in the cited AGS–MBR case | 50–60 kPa in the cited traditional MBR comparison | AGS–MBR review, 2021; configuration and sludge properties materially affect results |
The review evidence also shows why configuration and sludge properties matter. One cited AGS–MBR system operated for 78 days without physical cleaning, and another for 61 days. In the cited comparison, AGS–MBR operated at 3–6 kPa transmembrane pressure versus 50–60 kPa for traditional MBR (Aerobiotic Granular Sludge–Membrane BioReactor review, 2021). These are configuration-specific results, not universal MBR guarantees.
For chemical wastewater, compare a DF membrane bioreactor module against CAS using the same feed, pretreatment, effluent target, and sludge-disposal assumptions. Otherwise, the comparison may reflect different treatment scopes rather than different technologies.
Choose the process that matches the Florence site
Choose CAS when the wastewater is consistently biodegradable, the discharge route is permitted, capital cost dominates, and sufficient land is available for aeration and clarification. Choose MBR when footprint is constrained, high-quality solids separation supports reuse, variable discharge requires a stronger solids barrier, or a brownfield retrofit can use the existing basin footprint.
Do not proceed directly from a generic technology table when toxicity, pH variability, salinity, refractory organics, or cleaning chemistry remain unresolved. Those uncertainties can justify source-control changes, compound-specific pretreatment, or a pilot before equipment selection.
For a brownfield, compare membrane-cassette replacement or retrofit feasibility with a new CAS train. Existing basins may be reusable, but retrofit suitability depends on hydraulic capacity, structure condition, piping, aeration, controls, and membrane arrangement. Neither path should be assumed to have lower lifecycle cost without a matched design basis.
| Site condition | Provisional direction | Required check before commitment |
|---|---|---|
| Readily biodegradable feed, permitted sewer discharge, available land | CAS | Clarifier performance, sludge handling, and downstream discharge route |
| Land-constrained site or planned reuse | MBR | Effluent end use, reuse quality, membrane fouling strategy, and redundant capacity |
| Existing biological basin | MBR retrofit or CAS | Structural, hydraulic, aeration, piping, controls, and shutdown feasibility |
| Unresolved toxicity, pH swings, salinity, refractory organics, or incompatible cleaning chemicals | Neither process is ready for final selection | Source control, pretreatment feasibility, pilot evidence, and compatibility testing |
Require every bidder to use the same design basis, effluent target, pretreatment scope, membrane-life allowance, energy price, and sludge-disposal cost. The broader chemical-wastewater MBR versus CAS comparison is useful as a secondary check, but a plant decision still needs site-specific evidence.
Build a defensible lifecycle-cost comparison
A defensible lifecycle-cost comparison separates treatment-system cost from avoided utility, discharge, and disposal costs. It also keeps catalog benchmarks distinct from project guarantees.
List capital cost, pretreatment, aeration, membrane replacement, backwash, chemical cleaning, labor, sludge handling, energy, disposal, and avoided water or discharge charges. Use MBR wastewater cost per m³ in 2026 as a benchmark source, not a quotation.
The related industrial guide gives a 25–40% MBR capital-cost premium and a 6–10-year payback scenario for a 500 m³/day food-and-beverage plant. Its energy ranges are 0.4–0.8 kWh/m³ for MBR and 0.2–0.4 kWh/m³ for CAS. These values retain the guide’s food-and-beverage scope; they are not a local estimate for a Florence chemical plant. A chemical-plant model must use its own flow, feed, treatment, energy, reuse, and disposal inputs.
| Cost or sensitivity variable | Input required | Method for defensible use |
|---|---|---|
| Installed capital | Bid pricing with a common pretreatment, equipment, controls, installation, and civil scope | Compare like-for-like totals rather than catalog prices |
| Energy | 0.4–0.8 kWh/m³ MBR and 0.2–0.4 kWh/m³ CAS comparison ranges from the related industrial guide, 2026 | Replace with site-specific design consumption and applicable tariff |
| Membrane life and cleaning | Warranty terms, replacement allowance, cleaning frequency, chemical use, and labor | Test the result against conservative cleaning and replacement assumptions |
| Sludge | Mass, dewatering requirement, hauling, treatment, and disposal cost | Credit only verified reductions in the plant model |
| Reuse and avoided discharge | Permitted reuse quality, replacement demand, sewer charges, and compliance value | Separate contracted savings from uncertain regulatory benefits |
| Feed variability | Documented production, cleaning, dump, pH, salinity, and toxicity profile | Stress-test equalization, biological upset, cleaning, and peak-capacity costs |
Run low, base, and high cases for the most uncertain inputs. A payback period is only meaningful if the avoided-cost assumptions are documented and the plant is expected to operate long enough to realize them.
Procurement and commissioning checklist
A defensible procurement process separates design data, equipment guarantees, and site acceptance. Catalog claims establish a comparison basis; they do not demonstrate site performance.
- Require a current influent characterization and a written process design basis from every bidder.
- Request membrane material, pore size, expected flux, aeration arrangement, backwash and cleaning strategy, redundancy, and replacement assumptions.
- Require a signed compatibility list covering cleaning chemicals, coagulants, polymers, seal materials, and all permitted chemical additions.
- Require performance guarantees to identify the duty basis, sample points, analytical methods, startup conditions, and remedy for noncompliance.
- Confirm that electrical service, blowers, controls, pretreatment, sludge handling, and disposal are included in the scope.
- Make final acceptance contingent on site-specific pilot or validation evidence when the wastewater is chemically variable or biologically uncertain.
Also verify how the supplier handles membrane replacement, spare parts, service response, operator training, control narratives, and long-term consumables. The RO/UF membrane and filter-element portfolio can be used to review material and replacement options, but compatibility and warranty evidence must come from the selected process supplier.
| Acceptance item | Evidence to request | Risk if omitted |
|---|---|---|
| Design basis | Representative influent, duty cycle, target effluent, and pretreatment basis | Undersized or unsuitable equipment |
| Performance guarantee | Duty, sample points, analytical methods, startup conditions, and remedy | Ambiguous acceptance testing |
| Chemical compatibility | Signed material and process-chemical matrix | Premature membrane, seal, or gasket failure |
| Complete scope | Equipment, civil work, electrical, controls, pretreatment, sludge, commissioning, and training | Non-comparable bids and cost gaps |
| Validation | Pilot, validation, or site-specific performance evidence where needed | Transfer of untested assumptions |
Frequently Asked Questions
How much does MBR cost compared with CAS for chemical wastewater?
Do not use an energy range as an installed-cost estimate. The related industrial guide reports 0.4–0.8 kWh/m³ for MBR and 0.2–0.4 kWh/m³ for CAS, but actual cost also depends on pretreatment, civil work, membrane life, cleaning, sludge handling, and site controls. Request a site-specific model with the same scope and feed basis for both bids.
What flow capacity does the equipment cover, and how should it be sized?
The verified product catalog states that the integrated MBR system covers 10–2,000 m³/day, while DF modules are offered in 80–225 m² configurations producing 32–135 m³/day. These catalog values do not establish the selected train size. Require sizing based on representative peak flows, equalization behavior, membrane flux, redundancy, and the documented pretreatment and discharge targets.
Does MBR ensure compliance with chemical-specific discharge limits?
No. MBR improves physical solids separation and can retain biomass, but it does not establish that dissolved contaminants will meet every chemical-specific permit limit. For Florence, request the current sewer-discharge or permit conditions and demonstrate removal or source control for each regulated constituent using representative wastewater.
How should an MBR or CAS supplier be selected?
Compare bidders on chemical compatibility, membrane guarantees, fouling-control strategy, service support, and complete-scope pricing. The selection should also require a written performance guarantee, clear startup and acceptance criteria, replacement assumptions, and site-specific validation where the wastewater is variable or biologically uncertain. A low equipment price alone does not resolve those risks.