
What Brownsville Petroleum Operators Need to Decide
For Brownsville petroleum-wastewater projects, a membrane bioreactor generally fits variable refinery side-streams with free oil and a defined reuse benefit; conventional activated sludge remains credible for stable feeds with available land, reliable settling, and experienced operators. The choice should be made from the actual wastewater envelope, not from a universal MBR-versus-CAS ranking. A 500 m³/d side-stream illustrates the scale of a typical comparison, but it is not a universal design flow. TPDES requirements must be established from the facility’s current permit and discharge location. The supplied research identifies 30 TAC Chapter 305 but does not establish a universal Brownsville effluent limit, so operators should not adopt generic regulatory values as project criteria. The 2026 MBR cost and operating-cost guide is useful for framing the procurement questions, not for replacing site-specific design data.
Start the front-end decision with six site inputs: feed variability, oil and grease, salinity, available land, reuse value, and membrane-service access. Then establish the discharge or reuse envelope, including toxicity, nutrients, dissolved contaminants, and applicable monitoring conditions. A technology bid should be evaluated only after these inputs are documented. For brownfield sites with limited space, MBR can remove the secondary-clarifier constraint, but the resulting fouling-control, cleaning, and replacement obligations must be transferred into the project’s operating and service plan. Conversely, CAS should not be rejected on generic claims about variable feed; a stable, well-characterized stream may remain the lower-risk choice.
Why Petroleum Wastewater Changes the Comparison
Refinery contaminants can turn the solids-separation step into the controlling process constraint. Both technologies use an aerobic biological stage to remove biodegradable organics. In CAS, microorganisms form floc that must settle in a gravity clarifier. Poor flocculation, sludge bulking, or washout then carries biomass over the weir. An MBR retains biomass in the membrane tank and separates solids physically, so hydraulic retention time and solids retention time can be controlled independently.
That distinction matters when the biological treatment must retain slow-growing organisms capable of degrading hydrocarbons and phenols. The commercial comparison source, citing Ma et al. 2018, describes MBR operation at 8,000–12,000 mg/L mixed-liquor suspended solids, compared with 2,000–4,000 mg/L in CAS. Higher retained biomass can support the required organisms, but it does not by itself resolve poor settling or prevent contaminants from damaging the process.
The same commercial source identifies refinery screening conditions that should trigger closer scrutiny: TDS often above 5,000 mg/L and free-oil events exceeding 50 mg/L. These are warning conditions, not acceptance limits or universal Brownsville standards. TDS and salinity must be kept separate. Membrane separation retains suspended material; it does not remove dissolved salt. High salinity can inhibit biological activity, and additional treatment may be necessary when the required effluent or reuse specification demands it. For that combined treatment question, see high-salinity wastewater treatment and downstream desalination.
The procurement implication is straightforward: establish the normal feed, excursion envelope, and reuse specification before selecting equipment. If the failure mechanism is poor biomass settling under variable feed, MBR may remove the vulnerable step. If the failure mechanism is dissolved salt, toxicity, or an oil-contaminated membrane, biological separation alone will not solve it.
Pretreatment Determines Whether MBR Is Viable
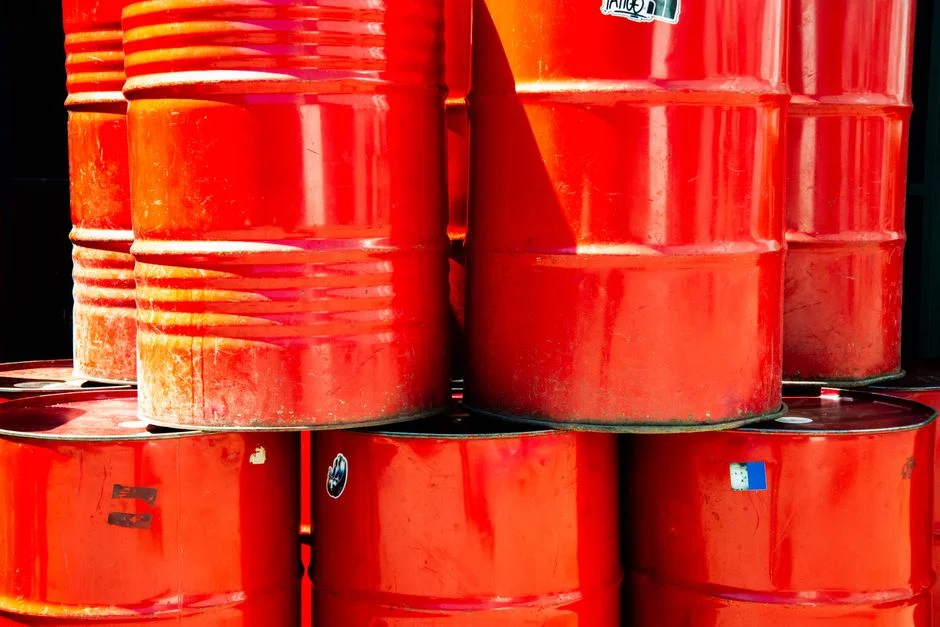
Free oil and grease can foul an MBR rapidly, so upstream separation is part of the MBR design rather than an optional accessory. The commercial source reports a 20–50 mg/L oil-and-grease range before an MBR treating coal-washing wastewater. That is a sourced screening reference, not a petroleum-wastewater acceptance criterion. The refinery design target must be confirmed through membrane compatibility review and representative testing.
A typical process sequence is:
- Segregate clean streams from oily, high-strength, or variable side-streams.
- Equalize flow and load to prevent shock loading.
- Remove free oil and grease, using an oil-water separator or DAF pretreatment for refinery oil and grease.
- Remove remaining suspended solids before the biological MBR.
- Apply biological treatment and membrane separation.
- Add downstream polishing where dissolved contaminants, nutrients, toxicity, or reuse quality require it.
DAF is suited to removing suspended solids, oil and grease, and colloidal material from industrial wastewater. Its performance must be accepted against the membrane’s actual sensitivity to surfactants, emulsified oil, solids carryover, temperature, and chemical demand. The supplier should define the pretreatment objective rather than repeat a generic oil-and-grease number.
| Procurement item | Information the bidder must define | Why it affects MBR selection |
|---|---|---|
| Feed segregation | Normal flow, peak flow, batch discharges, and incompatible streams | Reduces shock loads and membrane exposure |
| Oil and grease removal | Equipment basis, target performance, and carryover limit | Limits fouling and protects downstream biology |
| Solids control | Removal method and residual-solids envelope | Protects membrane flux and controls cleaning demand |
| Equalization | Usable volume and mixing approach | Stabilizes biological loading and pretreatment performance |
| Downstream treatment | Required removal of dissolved contaminants, nutrients, or toxicity | Prevents physical filtration from being mistaken for full compliance |
The final pretreatment target depends on membrane material, module geometry, influent temperature, biological loading, and pilot results. A generic MBR rule is not defensible for a refinery bid.
MBR and CAS Performance Side by Side
MBR replaces gravity settling with physical membrane separation; it does not remove the biological treatment step. The comparison below separates catalog facts and cited benchmarks from permit-specific obligations.
| Design issue | Membrane bioreactor | Conventional activated sludge | Qualification |
|---|---|---|---|
| Biological stage | Activated sludge with submerged membrane separation | Activated sludge followed by secondary clarification | Both require an appropriate biological design |
| Solids separation | Physical membrane barrier | Flocculation and gravity settling | CAS depends on settleability; MBR depends on fouling control |
| MLSS benchmark | 8,000–12,000 mg/L | 2,000–4,000 mg/L | Commercial comparison source, citing Mannina et al. 2019 and Ma et al. 2018 |
| Footprint | 60% smaller than conventional systems | Baseline conventional footprint | HydropureWater verified product catalog, 2026; commercial comparison, 2026 |
| Filtration | Below 1 μm | Clarifier-dependent solids separation | HydropureWater product catalog, 2026; do not convert this into a TSS or turbidity guarantee |
| Module construction | DF-series submerged PVDF flat-sheet modules | Not applicable | Product data: 0.1 μm pores, integrated aeration, individually replaceable elements |
| Module configurations | 80–225 m², producing 32–135 m³/day | Not applicable | DF-series product data |
The integrated submerged-MBR wastewater treatment system combines activated-sludge treatment with submerged PVDF filtration and is cataloged for 10–2,000 m³/day. The DF-series MBR modules use 0.1 μm pores, integrated aeration, and individually replaceable elements; the cited configurations are 80–225 m² producing 32–135 m³/day.
These facts support physical-separation and layout claims, not blanket permit compliance. Membrane filtration can improve solids separation, but it does not inherently remove dissolved salt, refractory organics, nutrients, or toxicity. Any discharge or reuse guarantee must identify the constituent, averaging period, flow condition, and pretreatment prerequisite. For petroleum facilities, also check petroleum wastewater pretreatment and local discharge limits.
Operating Cost, Maintenance, and Membrane Risk
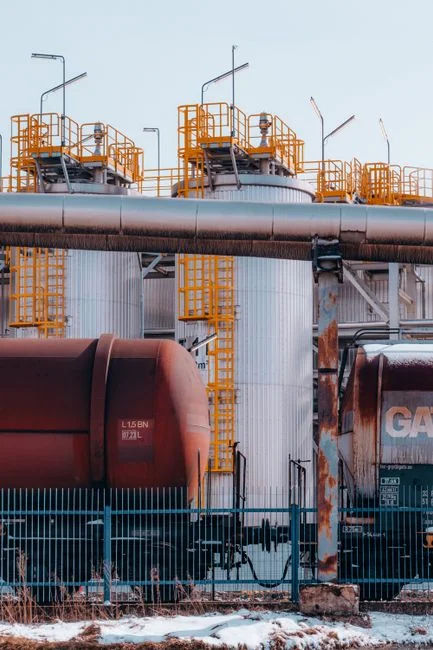
MBR’s energy penalty is only one part of its operating-cost difference. The commercial comparison source gives CAS energy use of approximately 0.6–1.0 kWh/m³ and MBR plant-wide demand at 1.3–1.6 times CAS. The same source reports direct emissions of 0.85 kgCO₂eq/m³ for CAS and 0.91 kgCO₂eq/m³ for MBR in its plant-wide benchmark. Site power mix, loading, aeration design, and operating hours can change those results.
An MBR operating-cost allowance must include air scour, relaxation and backwash cycles, chemical cleaning-in-place, membrane replacement, monitoring, and service support. The cited Bertanza et al. 2017 full-scale comparison reports membrane replacement every 7–10 years. Treat that interval as a cited benchmark, not a universal warranty. Include separate allowances for element replacement, cleaning chemicals, labor, and disposal of used elements.
CAS has different operating exposures: return-sludge pumping, wasting, clarifier maintenance, sludge handling, and the consequences of bulking or washout. A fair bid comparison must include those systems rather than comparing the membrane skid with an incomplete biological-train price.
Service access is a Brownsville-specific lifecycle issue. If no nearby membrane vendor or trained in-house team is available, define response time, spare-module strategy, and remote diagnostics before award. A missed cleaning cycle can escalate into a module-replacement event; a missed wasting cycle in CAS does not carry the same membrane consequence. The practical cost question is therefore not simply which train consumes more electricity, but which failure mode the site can manage with available staff and contractors.
The Business Case for MBR Water Reuse
Reuse can change the technology economics, but only a defined, water-quality-compatible end use creates recoverable value. The commercial source’s municipal benchmark gives an approximately 67-year MBR payback when reuse is not monetized. That figure explains why a disposal-only comparison can favor CAS; it does not represent a Brownsville refinery quotation.
The commercial source supplies two Cameron County scenario inputs: purchased water at $1.50–$3.00/m³ and avoided brine hauling at $15–$40/m³. These are scenario values, not universal market prices. In the supplied 500 m³/d example, reusing 30% of the permeate shifts the operating-cost crossover by roughly a factor of three against the municipal benchmark.
A refinery business case should calculate:
- Actual potable, treated-water, or make-up water displaced.
- Disposal, brine hauling, or discharge costs avoided.
- Pumping, blending, and distribution costs for reuse.
- Water-quality constraints imposed by the receiving process.
- Lost production or compliance exposure avoided by reliable reuse.
Cooling, process dilution, and scrubber supply are possible industrial end uses, but an identified use does not establish technical suitability. Obtain the receiving-water specification and demonstrate that MBR permeate can meet it reliably, including interactions from blending and storage. A vendor payback claim should disclose flow assumptions, water price, avoided hauling, chemical and energy costs, membrane replacement, financing, and the treatment capacity actually reused. Without those inputs, a payback period is not auditable.
Brownsville Decision Matrix and Procurement Checklist
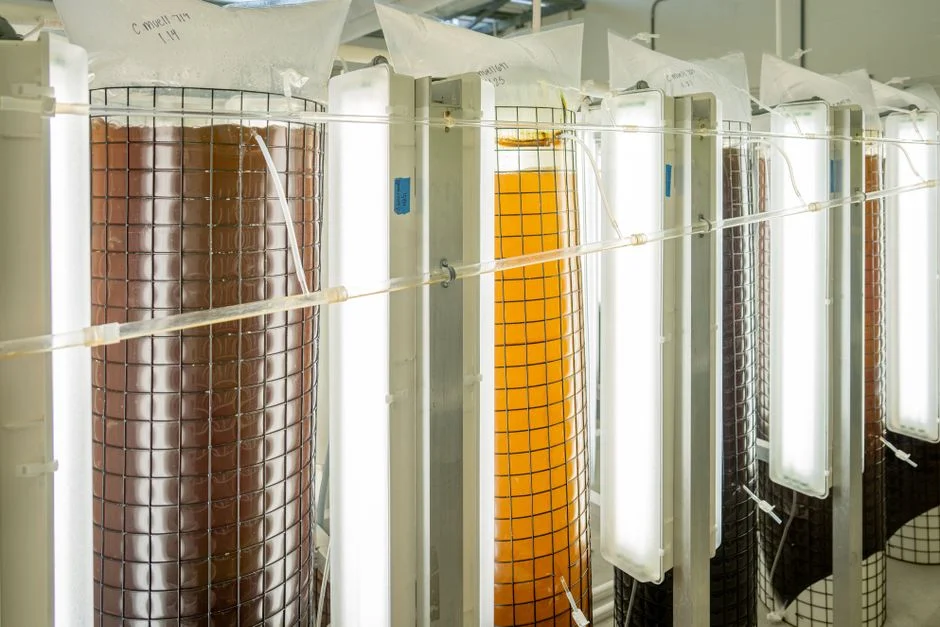
The strongest initial signal is the mismatch between feed behavior, land constraints, and the value of recovered water. The table organizes that screening logic; it does not replace site testing or permit review.
| Site condition | Initial direction | Decision to verify |
|---|---|---|
| Variable refinery feed with settling risk | Screen MBR | Can oil, solids, and shock loads be controlled upstream? |
| Stable feed with reliable gravity settling | Screen CAS | Is land, sludge handling, and experienced operation available? |
| Constrained existing pad | Favors preliminary MBR screening | Does the 60% footprint advantage survive site-specific piping and maintenance access? |
| Valuable cooling, dilution, or other reuse | Develop an MBR reuse case | Does permeate meet the actual end-use specification? |
| Limited reuse and available land | Retain CAS as the benchmark | Do lifecycle costs over the planning horizon support conventional treatment? |
| No nearby membrane-service support | Price the service risk | What response time, spares, and trained staffing are committed? |
Require 8–12 weeks of representative influent data, or the longest available operating record, covering COD, BOD, TSS, TDS, conductivity, oil and grease, pH, temperature, flow, toxicity, and contaminant spikes. Require bidders to define the pretreatment objective, membrane material, design flux, backwash and CIP frequency, aeration strategy, redundancy, controls, spare-parts strategy, and service response time.
Ask for guaranteed process values tied to the actual feed envelope. State how the guarantee responds to pretreatment upset, membrane scaling, chemical demand, membrane replacement, and force majeure. A fouling pilot is recommended before finalizing capital cost for high-TDS refinery feed according to the commercial source; that recommendation does not mean every project requires one.
Before purchase, verify the current TPDES permit, reuse specification, land constraint, electrical availability, and service coverage. If chemical feed is part of the proposed fouling-control strategy, evaluate the automatic chemical dosing system as part of the complete process rather than as an isolated accessory.
When Conventional Activated Sludge Remains the Better Choice
Conventional activated sludge is the stronger candidate when refinery feed is comparatively stable, gravity separation remains reliable, land is available, and no high-value reuse stream is planned. It also benefits from operator familiarity and a mature local operating base, particularly when membrane-service support is distant.
The cited Bertanza et al. 2017 full-scale comparison found better operating-cost economics for CAS. The commercial benchmark also places CAS at 0.85 kgCO₂eq/m³ and MBR at 0.91 kgCO₂eq/m³ under its stated assumptions. These results support a lifecycle assessment rather than an assumption that MBR is always more expensive or always more resilient.
The strongest Brownsville decision is not between two abstract technologies. It is between a treatment train whose biological loading, pretreatment, separation method, energy, maintenance, guarantees, and reuse assumptions match the refinery’s actual wastewater envelope. If CAS can meet the permit and reuse needs with reliable settling, a complete lifecycle bid may justify retaining it.
Frequently Asked Questions
How should MBR equipment be sized for a refinery wastewater application?
Begin with the required design flow and the complete feed envelope, not a catalog capacity alone. The HydropureWater MBR range is 10–2,000 m³/day, while the DF-series modules are available in 80–225 m² configurations producing 32–135 m³/day. Those values are catalog ranges, not site-specific process guarantees. Request the bidder’s hydraulic, biological, membrane-area, redundancy, and peak-flow calculations, then verify them against representative influent data and pilot results where needed.
Does filtration below 1 μm guarantee TPDES compliance for a Brownsville refinery?
No. Sub-1 μm filtration is a physical separation specification, not proof that every permit constituent will be met. Current permit conditions, discharge location, toxicity, nutrients, dissolved contaminants, and monitoring provisions must be established for the facility. Require guarantees by constituent and operating condition, and identify any downstream treatment needed before discharge or reuse.
Which supplier qualifications matter most when comparing membrane and conventional bids?
Request evidence that the bidder owns the complete process boundary, not only the membrane equipment. Evaluate pretreatment design, membrane data, feed-envelope guarantees, redundancy, controls, cleaning chemistry, replacement pricing, service response time, operator training, spares, and comparable operating references. A lifecycle submission should also disclose sludge handling for CAS and chemical-cleaning and replacement costs for MBR.
How should cost and pricing be compared without overstating MBR or CAS savings?
Compare the same wastewater duty and complete scope. Include clarifiers and sludge handling for CAS, and air scour, backwash, chemical cleaning, replacement, and service support for MBR. Use the supplied benchmarks—approximately 0.6–1.0 kWh/m³ for CAS and 1.3–1.6 times plant-wide demand for MBR—as screening references, not quotations. Request current vendor pricing based on the verified flow, feed analysis, pretreatment requirements, guarantees, and commercial terms.