
Why Brewery Wastewater Demands MBR Technology
Brewing generates 3–10 L of wastewater per liter of beer, with constituents dominated by sugars, soluble starch, ethanol, volatile fatty acids, and total suspended solids (SciDirect, 2015). That strength and volume profile is unusual among food-and-beverage streams: the water is biodegradable but highly variable, with surges tied to clean-in-place (CIP) cycles, spent-yeast discharges, and seasonal lager or ale campaigns. Restrictive municipal by-laws translate that profile into direct surcharges for high-strength discharge, which is why on-site biological treatment has shifted from optional to standard practice in new and retrofitted breweries (SciDirect, 2015).
Conventional activated sludge handles the load but struggles to meet tight discharge limits or reuse targets because the clarifier cannot retain all biomass. MBR technology solves this by coupling a suspended-growth bioreactor with an ultrafiltration membrane, eliminating the clarifier and producing a near-reuse-quality permeate. The same decoupling of hydraulic retention time (HRT) from solids retention time (SRT) lets engineers push mixed liquor suspended solids (MLSS) higher, shrink tankage, and produce water clean enough for cleaning, cooling-tower makeup, or even boiler feed, displacing fresh-water purchases in the utility budget.
AnMBR vs Aerobic MBR: Performance Data for Brewery Effluent
An anaerobic membrane bioreactor (AnMBR) removed approximately 98% of COD from brewery wastewater at a biogas yield of 0.53 ± 0.015 m³ biogas per kg COD removed at 35°C in a submerged hollow-fiber pilot (SciDirect, 2015). The observed specific MLVSS growth rate was 0.022 ± 0.001 gVSS/gVSS/d and the yield 0.029 ± 0.001 gVSS/gCOD, confirming slow biomass turnover and low sludge disposal cost. Critical flux for that membrane was 8.64 ± 0.69 L/m²/h, and long-term stable operation was achieved at 8 L/m²/day with periodic chemical recovery cleaning. Earlier work by Anderson et al. reported 99% COD removal at OLR greater than 20 gCOD/L/d on brewery wastewater, while Ince et al. reported effluent COD of 220, 440, and 660 mg/L at OLRs of 7.5, 11.5, and 17.3 gCOD/L/d respectively, with biogas energy covering approximately 75% of the CUMAR system's operating energy demand (SciDirect, 2015).
Aerobic MBR produces a permeate with filtration below 1 μm, a quality suitable for water reuse, in skid capacities from 10 to 2,000 m³/day, with a footprint about 60% smaller than conventional activated-sludge systems of equivalent throughput (HydropureWater product catalog). Choosing between these technologies depends on influent strength and energy goals; when influent COD is consistently above 3,000 mg/L and on-site biogas use is feasible, AnMBR recovers energy, whereas aerobic MBR is the better fit for lower-strength streams or reuse-grade effluent.
| Parameter | AnMBR (pilot data) | Aerobic MBR (catalog) |
|---|---|---|
| COD removal | ~98% (up to 99% at OLR >20 gCOD/L/d) | Typically >95% with nitrification |
| Biogas yield | 0.53 m³/kg COD removed at 35°C | None |
| Critical flux | 8.64 ± 0.69 L/m²/h | 15–25 L/m²/h typical (vendor data) |
| Effluent quality | Low TSS; COD 220–660 mg/L at tested OLRs | Near-reuse (<1 μm filtration) |
| Footprint | No aeration; smaller tankage | ~60% smaller than conventional activated sludge |
| Energy balance | Biogas offsets ~75% of operating energy | Aeration dominates OPEX |
Membrane Configuration & Fouling Control: Hollow Fiber vs Flat Sheet
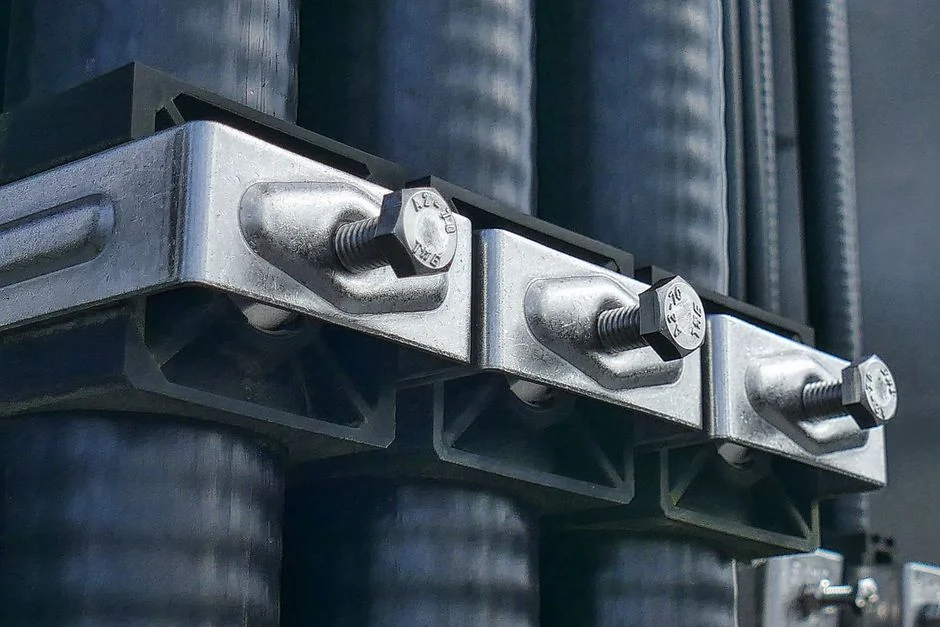
The AnMBR pilot referenced above used a submerged hollow-fiber module with a 0.04 μm nominal pore size and 0.047 m² of membrane area, with biogas scouring for fouling control and PLC-controlled permeation/relaxation cycles (SciDirect, 2015). Size-fraction analysis of extracellular polymeric substances (EPS) showed that particulate proteins and polysaccharides were the dominant foulants under sub-critical flux operation, and the authors concluded that chemical recovery cleaning is necessary to maintain stable long-term filtration at 8 L/m²/h when treating brewery wastewater (SciDirect, 2015). Sustainable operation typically targets 80–90% of measured critical flux — 8.64 L/m²/h in the cited pilot — to stay sub-critical and minimize irreversible fouling.
Hollow fiber offers high packing density and is well proven at full scale, but fibers are difficult to inspect individually and can entangle debris from upstream upsets. Flat-sheet PVDF modules in the 0.1 μm range, such as the PVDF flat sheet membrane modules for submerged MBR configurations, expose each panel for visual inspection, allow element-by-element replacement, and operate with integrated coarse-bubble aeration that typically draws an order of magnitude less air than cross-flow designs. Selecting between these configurations requires balancing the trade-off between higher membrane area density and ease of maintenance.
| Attribute | Hollow fiber (0.04 μm) | Flat sheet PVDF (0.1 μm) |
|---|---|---|
| Packing density | High | Moderate |
| Inspection / replacement | Module-level | Element-level |
| Scouring air demand | Biogas or compressed gas | Integrated coarse-bubble, low air rate |
| Fouling control | Backwash + relax + chemical CIP | Relax + chemical CIP; periodic drain-down |
| Best fit | High MLSS AnMBR, tight footprint | Aerobic MBR, variable load, ease of maintenance |
Sizing Parameters: OLR, HRT, and Flux for Full-Scale Design
The AnMBR pilot covered organic loading rates from approximately 2 to 20+ gCOD/L/d; during a batch-fed start-up at 2 gCOD/L/d, soluble COD removal climbed from 20% to 80% in 20 days (SciDirect, 2015). Because the membrane decouples HRT from SRT, Ince et al. operated mixed liquor between 10 and 50 g/L without biomass washout, demonstrating the volumetric intensification AnMBR enables (SciDirect, 2015). Sizing then reduces to membrane area: required membrane area equals peak daily flow divided by design flux, with 8 L/m²/day (192 L/m²/day, or 0.192 m³/m²/day) as a defensible sustainable target for brewery-strength wastewater. Biogas handling scales with load: a plant receiving 5,000 kg COD/day at 98% removal generates roughly 0.53 × 5,000 × 0.98 ≈ 2,600 m³ biogas/day, which sets the gas collection, storage, and utilization train. Alkalinity consumption was tracked in the pilot and should be carried into the alkalinity-dosing system design to prevent pH drift toward inhibition (SciDirect, 2015).
Pre-Treatment & Integration Checklist for Brewery Sites
Most MBR failures on brewery sites trace back to inadequate pre-treatment, not to the membrane itself. Spent grain, hops trub, and yeast carryover will blind hollow fibers within hours if not screened, and CIP caustic streams can swing the bioreactor pH past the survival range for methanogens or nitrifiers. A defensible upstream train is: rotary bar screening at 2 mm or finer, with a rotary bar screen rated for fibrous brewery debris; an equalization tank sized for at least 24 hours of HRT to dampen CIP pH swings (commonly 2–12) and flow peaks; dissolved air flotation for FOG and colloidal solids ahead of any aerobic MBR, using a DAF unit sized to peak wet-weather flow; and nutrient balancing, because brewery wastewater is characteristically low in nitrogen and phosphorus, typically requiring urea and phosphoric acid dosing to maintain a BOD:N:P ratio near 100:5:1 for stable biological treatment. High-pH caustic CIP waste should be segregated and neutralized in a dedicated side stream before it reaches the biological stage.
Equipment Selection Framework: Matching Specs to Brewery Requirements
The first procurement decision is the objective: AnMBR if energy recovery from biogas is the priority, aerobic MBR if reuse-grade permeate or nitrogen removal dominates, and either configuration if the goal is simply discharge compliance. With the objective fixed, the technical checklist narrows. Require vendors to warrant sustainable flux on brewery wastewater and to provide at least one operating reference; the AnMBR pilot data showed that long-term stability at 8 L/m²/day required periodic chemical recovery cleaning, so ask for documented cleaning frequency, chemical consumption, and downtime projections rather than a single flux number. For AnMBR, confirm gas-tight reactor design, biogas handling, and flare or CHP integration. For aerobic MBR, confirm separate blower sizing for process aeration versus membrane scouring, since they are controlled independently. Footprint matters in any brewery retrofit, and the integrated aerobic MBR system for brewery water reuse delivers approximately 60% of the footprint of a conventional activated-sludge train at equivalent throughput, with skid capacities from 10 to 2,000 m³/day (HydropureWater product catalog). Flat-sheet modules such as the DF Series are offered in panel areas of roughly 80–225 m² per cassette, each producing on the order of 32–135 m³/day of permeate at typical design fluxes (HydropureWater product catalog). PLC-controlled permeation and relaxation cycles are standard; confirm remote monitoring, data logging, and predictive fouling alerts before signing.
| Selection criterion | What to require from the vendor |
|---|---|
| Sustainable flux on brewery effluent | Guaranteed value (e.g., 8 L/m²/day) with reference plant |
| Cleaning protocol | Frequency, chemicals, recovery procedure, downtime budget |
| Biogas handling (AnMBR) | Reactor gas-tightness, flare, CHP or boiler tie-in |
| Blower sizing (aerobic MBR) | Separate process vs membrane scouring blowers, turndown range |
| Footprint & modularity | Skid area, cassette replacement procedure, expandability |
| Automation | PLC permeation/relax cycles, remote telemetry, fouling alerts |
Frequently Asked Questions
What is the typical CAPEX for a 500 m³/day brewery MBR system?
System price depends on influent strength, effluent targets, and the chosen AnMBR-versus-aerobic configuration, as research data does not provide a standard per-m³ CAPEX figure for brewery applications. Buyers should request line-item quotations for tankage, membrane modules, blowers, biogas handling, and instrumentation, then benchmark against the 2026 MBR cost benchmarks per m³/day to validate the spread.
How long do MBR membranes last treating brewery wastewater, and what drives replacement?
Membrane life is shortened by sustained operation above critical flux, incomplete chemical recovery cleaning, and exposure to CIP upsets that pass inadequate pre-treatment. The AnMBR pilot confirmed that chemical recovery cleaning is necessary to maintain stable long-term filtration at 8 L/m²/h when treating brewery wastewater, so cleaning discipline rather than calendar time is usually the dominant variable (SciDirect, 2015).
Can an existing aerobic activated sludge plant be retrofitted with MBR membranes?
Existing activated sludge plants can be retrofitted by converting the clarifier volume into additional bioreactor capacity and installing a membrane tank downstream. The retrofit typically increases MLSS, shrinks footprint, and elevates effluent quality to reuse grade, but the blower train, equalization volume, and screening must be re-evaluated against the new operating window.