
Why design parameters matter more than the stack you buy
Electrodialysis uses alternating anion- and cation-exchange membranes under an electric field to produce a dilute and a concentrate stream, with no phase change and no chemical reaction (ScienceDirect topic overview, 2026). That mechanical simplicity is misleading. The 2026 framing from the SED-GNDE study (Huang et al., Water Research, 25 Jun 2026) is direct: nutrient recovery in selective electrodialysis is governed by three coupled parameter families — wastewater characteristics, membrane properties, and operating conditions — and none of them can be specified in isolation.
This is the engineering tension the rest of the article builds around. Voltage too high drives water splitting, pH shift, and inorganic scaling on the concentrate side. Voltage too low leaves membrane area underused and pushes residence time past economic limits. Flow too low starves mass transfer at the membrane surface and triggers concentration polarisation. Flow too high shortens residence time below the target residual. The skill is to choose voltage, current density, flow, and membrane area together so that the operating point sits below the limiting current density (LCD) of the feed.
Two 2026 papers change what "parameter specification" means. Georgievna et al. (Environmental Technology, 06 Jul 2026) showed that pulsed electric field (PEF) operation at 5–10 mA/cm², 500 ± 20 Hz, and a duty cycle of 0.2 cut specific energy consumption by 1.2–2.2× relative to DC at the same average current density. Huang et al. (2026) reported NRMSE 0.032 and NMAE 0.014 for an active-learning voltage-and-flow model that remained robust under coordinated voltage-flow regulation. A 2026 datasheet therefore has to lock in not just numbers but a control mode.
The three parameter families every ED datasheet must capture
Every ED system specification can be split into three families, and the engineering question is always how a value chosen in one family constrains the others.
Family 1 — wastewater characteristics. The target ion and its concentration set the salt-loading rate, which drives the stack area. pH controls speciation: Kosmerl et al. (University of the Aegean, accessed 2026) operated at pH 3 for both 80 mg/L Cr(VI) and 50 mg/L Ni²⁺ feeds, so pH was treated as a controllable input, not a feed property. Conductivity and TDS set the ohmic voltage drop and therefore the rectifier size. Suspended solids, oil and grease, surfactants, and natural organic matter all consume the LCD budget by fouling the membrane surface; the refinery matrix studied by Georgievna et al. (2026) explicitly contains salts, petroleum products, and surfactants, which is the realistic fouling envelope for an industrial duty. Temperature affects both conductivity and membrane resistance, so it belongs on the datasheet even when it is not actively controlled.
Family 2 — membrane properties. The minimum is CEM/AEM material, effective area per cell pair, and total cell-pair count. For selective or bipolar variants, selectivity for the target monovalent over competing divalents is the headline parameter; the ScienceDirect overview (2026) documents Selemion CSO at 94.5% Li⁺/Mg²⁺ selectivity in simulated brine and ASTOM monovalent-selective membranes in the 62.7–90.5% range across real and simulated brines. Membrane thickness, spacer geometry, and electrical resistance determine the per-cell-pair voltage drop and the achievable current density. Kosmerl et al. (accessed 2026) used commercial Ionac MC 3470 cation-exchange and Ionac MA 3475 anion-exchange membranes as a worked example for Cr(VI) and Ni²⁺ removal.
Family 3 — operating conditions. Applied voltage and average current density set the operating point relative to LCD. Flow velocity and residence time set mass transfer and conversion per pass. The 2026 PEF-ED study (Georgievna et al., 2026) reported an average current density window of 5–10 mA/cm², a frequency of 500 ± 20 Hz, and a duty cycle of 0.2. The Cr(VI)/Ni²⁺ work (Kosmerl et al., accessed 2026) reported feed flow rates of 52.8 mL/min and 42.6 mL/min respectively, both over 90 min batch operation.
The families are coupled: the Lim et al. study on cadmium ED (Desalination and Water Treatment, 2011) showed that LCD rises linearly with both feed concentration and flow rate, so a wastewater decision and an operating-condition decision cannot be made independently.
| Family | Parameter | Worked value from 2026 sources | Source |
|---|---|---|---|
| Wastewater | Target ion concentration | 80 mg/L Cr(VI); 50 mg/L Ni²⁺ | S3 (accessed 2026) |
| Wastewater | pH | 3 (Cr(VI) and Ni²⁺ duty) | S3 (accessed 2026) |
| Wastewater | Feed matrix | Salts + petroleum products + surfactants (refinery) | S4 (2026) |
| Membrane | CEM/AEM material | Ionac MC 3470 / MA 3475 | S3 (accessed 2026) |
| Membrane | Monovalent selectivity | 94.5% Li⁺/Mg²⁺ (Selemion CSO); 62.7–90.5% (ASTOM) | S2 (2026) |
| Operating | Applied voltage | 30 V (Cr(VI)); 25 V (Ni²⁺) | S3 (accessed 2026) |
| Operating | Average current density | 5–10 mA/cm² (PEF mode) | S4 (2026) |
| Operating | Feed flow rate | 52.8 mL/min (Cr(VI)); 42.6 mL/min (Ni²⁺) | S3 (accessed 2026) |
| Operating | Residence time | 90 min batch | S3 (accessed 2026) |
| Operating | PEF frequency / duty cycle | 500 ± 20 Hz; 0.2 | S4 (2026) |
Voltage, current density and the limiting-current ceiling
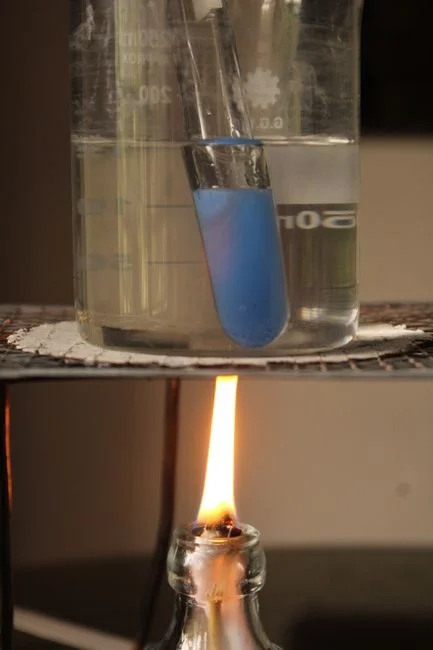
Limiting current density is the point at which ion transport through the membrane equals the supply of ions to the membrane surface from the bulk feed. Above LCD, the membrane surface runs out of ions, water dissociates to keep the current flowing, and the system enters concentration polarisation with pH shift, hydroxide generation, and inorganic scaling on the concentrate side. Lim et al. (2011) measured this directly: LCD rose linearly with cadmium concentration and with flow rate, and the elapsed time to reach 0.1 mg Cd/L scaled directly with the initial dilute concentration, while concentrate concentration had an insignificant effect on removal rate.
The practical translation of the LCD ceiling into a voltage window is given by Kosmerl et al. (accessed 2026) for two worked cases. For 80 mg/L Cr(VI) at pH 3 with 0.5 g Na₂SO₄ as supporting electrolyte, 30 V across the stack drove 98.5% removal in 90 min, with a residual of 1 mg/L, energy consumption of 40 Wh/L, flow efficiency of 30%, and flux of 12 × 10⁻⁵ mol/m²·s. For 50 mg/L Ni²⁺ at pH 3 with 0.2 g Na₂SO₄, 25 V drove 94.3% removal in 90 min, residual 4 mg/L, energy 34 Wh/L, flow efficiency 96.51%, and flux 40 × 10⁻⁵ mol/m²·s. The voltage is not a constant: it is tuned per target ion and per supporting-electrolyte dose.
Operating at roughly 70–90% of the measured LCD is the standard safety margin against polarisation, and the recommended verification is a voltage-versus-current sweep during commissioning to locate the knee of the curve. The PEF-ED results (Georgievna et al., 2026) sit inside this same logic but extend it: at 5–10 mA/cm² average current density, PEF mode increased desalination rate by 1.6–2.0× relative to DC at the same average current density and stabilised concentrate pH, which directly attacks the scaling mechanism that limits DC operation in refinery feeds. The reader looking for a worked Cr(VI) removal design blueprint can apply the 30 V / pH 3 / 0.5 g Na₂SO₄ starting point from Kosmerl et al. directly to a 2026 datasheet.
Flow rate, residence time and stack sizing
Flow rate and residence time are the two operating parameters that convert a target throughput and a target residual into a stack. The Kosmerl et al. (accessed 2026) bench numbers are the cleanest anchor in the research set: 52.8 mL/min for the Cr(VI) duty and 42.6 mL/min for the Ni²⁺ duty, both over a 90 min batch. These are laboratory-scale flows, so the engineering job is to keep the same residence-time logic and scale the cross-section, not the linear velocity, when moving to production flow.
Flow rate is not free. Lim et al. (2011) showed that raising flow rate raises LCD, which means a higher feed flow is more forgiving on the voltage window before polarisation sets in. The trade-off is that residence time falls as flow rises, so the design must balance both. The way to do this on paper is to fix a target salt-loading rate (concentration × flow), divide by an allowable flux per unit membrane area, and back-calculate the membrane area; then fix a target residence time from the residual spec, and check that the resulting flow is consistent with the LCD margin.
For selective ED the operating envelope is very different. The ScienceDirect overview (2026) reports that Selemion CSO in simulated brine at 400 mA/m² gave 94.5% Li⁺/Mg²⁺ selectivity with only 20.2–33.0% Li recovery, and that the same membrane in East-Taijiner old brine gave 90.5% selectivity with 9.89% Li recovery at 20.7 mA/m². These current densities are far below desalination duty, residence times are correspondingly longer, and the design target is selectivity per pass rather than bulk salt removal. Conflating the two envelopes is the most common reason selective ED systems under-deliver. Sizing logic in both cases is the same: stack area is set by salt-loading rate divided by allowable flux, and cell-pair count is set by the per-membrane voltage drop and the total applied voltage the rectifier will deliver.
Membrane and stack configuration: SED, BMED, ILMED and standard ED
Standard ED with alternating CEM and AEM is the correct default for bulk desalination, heavy-metal removal, and refinery demineralisation. The Cr(VI) and Ni²⁺ removals in Kosmerl et al. (accessed 2026) and the PEF-ED refinery work in Georgievna et al. (2026) both sit inside this envelope. For heavy-metal polishing in metals and refining duty, an ED stack followed by RO or EDR is a common 2026 train; the design context for this is laid out in the electroplating wastewater ZLD design reference.
Selective electrodialysis (SED) replaces standard IEMs with monovalent-selective IEMs and is the right choice when the duty is a monovalent over a competing divalent. The ScienceDirect overview (2026) documents Selemion CSO at 94.5% Li⁺/Mg²⁺ selectivity in simulated brine and ASTOM monovalent-selective membranes at 62.7–90.5% selectivity in real and simulated brines; both belong in any selective-recovery datasheet.
Bipolar membrane electrodialysis (BMED) layers a bipolar membrane into the stack to split water into H⁺ and OH⁻, enabling in-situ acid and base generation from a salt feed. The ScienceDirect overview (2026) notes that replacing HCl and NaOH feeds with H₃BO₃ and LiOH in BMED had a negligible effect on Li and B recovery at optimal operating parameters, which is a useful counterexample to the assumption that BMED always needs strong acid and caustic loops.
Ionic liquid membrane ED (ILMED) and shock ED are niche variants. ILMED uses a liquid ion-exchange phase between feed and permeate and has been applied to Li⁺/Mg²⁺ separation; the ScienceDirect overview (2026) reports Hoshino and co-workers operating ILMED at 2–3 V for Li⁺ recovery from seawater. Shock ED was originally developed for desalination and has been extended to ion separation and heavy-metal removal. They are worth knowing exist, but a standard industrial duty does not need to over-spec for them.
| Variant | Membrane stack | Fit for duty | Evidence |
|---|---|---|---|
| Standard ED | Alternating CEM / AEM | Bulk desalination, heavy-metal removal, refinery demineralisation | S3 (accessed 2026); S4 (2026) |
| SED | Monovalent-selective IEMs | Monovalent over divalent separation (Li/Mg, Na/Ca) | S2 (2026): 94.5% Li/Mg (Selemion CSO); 62.7–90.5% (ASTOM) |
| BMED | CEM + AEM + bipolar membrane | Acid/base generation from salt; Li and B recovery | S2 (2026) |
| ILMED | Liquid ion-exchange phase between feed and permeate | Niche Li/Mg separation at 2–3 V | S2 (2026) |
| Shock ED | Field-driven ion exclusion in porous media | Advanced desalination and heavy-metal removal | S2 (2026) |
Control modes in 2026: DC, pulsed electric field and model-predictive ED
DC mode is the baseline. It is simple, well-understood, and vulnerable to scaling and concentration polarisation in feeds that contain calcium, magnesium, bicarbonate, or silica — which is essentially every refinery, metals, and salt-processing wastewater. The PEF and model-predictive options in the 2026 literature exist because DC leaves performance on the table in those exact feeds.
Pulsed electric field (PEF) mode was characterised by Georgievna et al. (2026) for refinery demineralisation at 5–10 mA/cm² average current density, 500 ± 20 Hz, and a duty cycle of 0.2. Against DC at the same average current density, PEF cut specific energy consumption by 1.2–2.2× and raised the desalination rate by 1.6–2.0×. The mechanism reported in the paper is pH stabilisation in the concentrate chamber, which reduces inorganic scaling. High removal of Fe and Cr was achieved at the optimal pulse frequency, and the treated real wastewater met international quality standards for industrial reuse. PEF is therefore not a research curiosity; it is a credible rectifier upgrade for a 2026 build.
Model-predictive and active-learning control were demonstrated by Huang et al. (2026) with the SED-GNDE model. Under an active-learning data strategy, the model reached NRMSE 0.032 and NMAE 0.014, and remained robust under variable voltage and coordinated voltage-flow regulation. The authors explicitly position the model as a foundational module for model-predictive control of dynamic ED operation. For a 2026 procurement, the practical implication is to specify a PLC platform that can host a model-predictive layer later, even if the first build ships in DC or PEF mode. The cost of reserving that optionality is small; the cost of re-wiring a control panel later is not.
| Control mode | Operating window | Reported benefit | Source |
|---|---|---|---|
| DC | Constant V or constant I | Baseline; simple; vulnerable to scaling | S4 (2026) |
| Pulsed electric field (PEF) | 5–10 mA/cm² average; 500 ± 20 Hz; duty cycle 0.2 | 1.2–2.2× lower specific energy; 1.6–2.0× higher desalination rate; concentrate pH stabilised | S4 (2026) |
| Model-predictive / active-learning | Coordinated voltage-flow regulation | NRMSE 0.032, NMAE 0.014; robust under dynamic operating modes | S1 (2026) |
Supporting systems: electrolyte, pH control, pretreatment and electrodes
The ED stack only delivers the datasheet numbers if the supporting systems around it are also specified. The Kosmerl et al. (accessed 2026) protocol is explicit: 0.5 g Na₂SO₄ for the 80 mg/L Cr(VI) feed and 0.2 g Na₂SO₄ for the 50 mg/L Ni²⁺ feed were added to raise conductivity at low feed concentration. The engineering question is how much supporting electrolyte to dose to keep voltage inside the ohmic region without overshooting downstream conductivity limits; this is a tunable parameter, not a constant, and it is best handled by an automatic chemical dosing system for pH and supporting electrolyte that tracks feed conductivity online.
pH control matters on both sides of the membrane. Kosmerl et al. (accessed 2026) operated at pH 3 for both Cr(VI) and Ni²⁺ to keep the target ion in the right species. Georgievna et al. (2026) showed that PEF mode stabilised pH in the concentrate chamber, which is the side that normally scales. The datasheet should therefore specify both feed pH and concentrate pH, not feed pH alone.
Pretreatment is what protects the LCD budget. Huang et al. (2026) and the ScienceDirect overview (2026) both flag organics, surfactants, and suspended solids as foulants that consume the polarisation margin. For an oily refinery or metals-finishing feed, DAF pretreatment for FOG and suspended solids is the standard first stage. Electrode materials are the last supporting decision: Kosmerl et al. (accessed 2026) used carbon-fibre cathode and stainless-steel anode; for chloride-bearing feeds the engineer should request coated or dimensionally stable anodes to control chlorine evolution at the anode.
Design checklist and equipment selection for 2026 builds
A complete ED datasheet for a 2026 build should include the following lines, each cross-referenced to the 2026 source that supports it: target ions and concentrations (S3 accessed 2026), pH window (S3 accessed 2026), feed conductivity and TDS, applied voltage (S3 accessed 2026), average current density (S4 2026), feed flow rate and residence time (S3 accessed 2026), target recovery and target residual (S3 accessed 2026), LCD margin (S5 2011), membrane type and area (S3 accessed 2026; S2 2026), and control mode — DC, PEF (S4 2026), or model-predictive (S1 2026).
For a metals, refinery, or salt-producing plant, the supporting-equipment map is consistent. DAF for FOG, TSS, and colloids upstream of the stack. Multi-media filtration ahead of the ED stack for residual turbidity. Automatic chemical dosing for pH and supporting electrolyte. Instrumentation for online voltage, current, flow, conductivity, and pH feedback into the rectifier and PLC. For polishing or hybrid trains, a position downstream of the ED stack in an RO or EDR loop is conventional; a worked RO polishing stage after ED and an EDI electrodeionization polishing stage are both available when the duty requires it. The verification step before any full-scale order is a bench or pilot run using the S3 protocol — 90 min batch, parameter sweep across voltage, pH, and electrolyte dose — to confirm that the LCD margin and the residual are achievable on the actual feed.
For a quick scoping view of how an ED stage fits into a broader industrial treatment train, the CMP wastewater equipment cost comparison 2026 reference gives one worked industrial cost frame for a related duty.
Frequently Asked Questions
What parameters should an electrodialysis datasheet actually capture in 2026?
At minimum: target ion identity and concentration, pH window, feed conductivity, applied voltage, average current density, feed flow rate, residence time, target recovery, target residual, LCD margin, membrane type and area, and control mode (DC, PEF, or model-predictive). The 2026 sources that anchor each line are S1 (2026) for the three-family parameter model and model-predictive readiness, S3 (accessed 2026) for the worked pH, voltage, electrolyte dose, and flow numbers, S4 (2026) for the PEF operating window, and S5 (2011) for the LCD scaling rules.
How do I decide between DC, PEF and model-predictive control for a 2026 build?
Use DC for simple feeds where polarisation is easy to manage. Specify PEF when the feed is a refinery or metals matrix with petroleum products and surfactants; Georgievna et al. (2026) reported 1.2–2.2× lower specific energy and 1.6–2.0× higher desalination rate at 5–10 mA/cm², 500 ± 20 Hz, and duty cycle 0.2. Specify a PLC platform that can later host a model-predictive layer if nutrient-recovery or variable-feed operation is on the roadmap; Huang et al. (2026) reported NRMSE 0.032 and NMAE 0.014 for an active-learning model that remained robust under variable voltage and coordinated voltage-flow regulation.
How should I scope a budget for an electrodialysis system without a vendor quote yet?
The 2026 sources do not publish equipment pricing, so a defensible budget has to be built from the parameters that drive cost: membrane area, cell-pair count, rectifier size (set by voltage and current density), pretreatment and dosing packages, and control platform. The engineer should request from each bidder a price broken down by membrane area, rectifier kW, control platform tier (DC, PEF, or model-predictive), and supporting skids. The benchmark operating numbers to demand in the proposal are 5–10 mA/cm² average current density for PEF, a 70–90% LCD margin in the design point, and a flow/residence-time pair consistent with the 90 min batch logic in Kosmerl et al. (accessed 2026).
What should I check when selecting an electrodialysis supplier for an industrial duty?
Ask for a bench or pilot run on the actual feed using a protocol similar to Kosmerl et al. (accessed 2026) — 90 min batch with a parameter sweep across voltage, pH, and supporting-electrolyte dose — and demand the resulting LCD, current efficiency, energy consumption, and flux numbers in writing. Confirm the rectifier can deliver the chosen control mode (DC, PEF at 500 ± 20 Hz / duty cycle 0.2, or a model-predictive interface per S1 2026). Confirm the membrane stack is built with commercial IEMs of documented selectivity for the target duty (S2 2026 lists Selemion CSO at 94.5% Li/Mg and ASTOM at 62.7–90.5% as benchmarks), and confirm the supplier can supply the supporting pretreatment and dosing skids in the same scope so that the LCD budget is not consumed upstream of the stack.