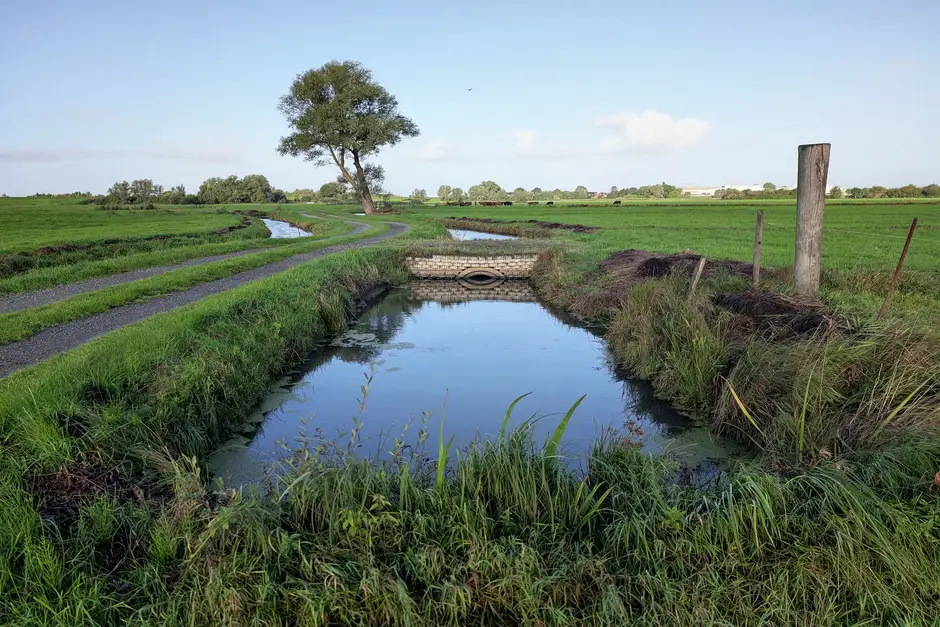
What a healthy oxidation ditch looks like before something goes wrong
An oxidation ditch is a modified activated sludge process that circulates mixed liquor around a racetrack-shaped basin at 0.25–0.35 m/s (0.8–1.2 ft/s), using brush rotors, disc aerators, or fine-bubble diffusers to transfer oxygen and keep biomass in suspension (EPA 832-F-00-013, 2000). Healthy ditches run at 12–24 days SRT for nitrification and 6–30 hours HRT, removing >90% of BOD, TSS, and ammonia; with a Modified Ludzack-Ettinger (MLE) anoxic zone, total nitrogen removal reaches 90–94%.
The DO profile of a healthy loop is the single most diagnostic indicator. Oxygen peaks at 2.0–3.0 mg/L immediately behind the brush rotor, then declines as biomass consumes it; by the time the mixed liquor reaches the far end of the loop, DO is still 1.5–2.0 mg/L. That natural swing — high DO at the aerator, low DO at the tail end — is what drives simultaneous nitrification-denitrification in a single basin without a separate anoxic tank.
Two real plants anchor the design baseline. Casa Grande, AZ (4.0 MGD) has consistently produced 8.86 mg/L BOD, 5.23 mg/L TSS, and 1.99 mg/L total nitrogen for 94% TN removal since 1996. Edgartown, MA (0.20–0.75 MGD seasonal) hits 3.14 mg/L BOD, 5.14 mg/L TSS, and 2.33 mg/L TN for 90% TN removal (City of Casa Grande, 1999; Town of Edgartown, 1999; both via EPA 832-F-00-013, Table 1 and 2). The EPA's typical design point — 15 lb BOD/1000 ft³·day at 4,000 mg/L MLSS — produces an F:M near 0.10 kg BOD/kg MLSS·day, the extended-aeration regime that nitrifies reliably and wastes less sludge than plug-flow at comparable loadings.
Channel velocity is the floor that keeps the system honest. At 0.25 m/s (0.8 ft/s) mixed liquor stays in suspension; below that, MLSS settles into dead zones, those zones go anaerobic, and the ditch starts producing the failure modes the rest of this article covers.
The five measurements that diagnose almost every oxidation ditch problem
Every common ditch failure — foaming, bulking, low DO, nitrification collapse, rising sludge, brush rotor wear, sulfide odor — maps to one of five measurements. Operators who run these five tests on a fixed schedule diagnose faster than operators who react to symptoms.
Dissolved oxygen profile. Walk a hand-held DO probe around the loop and record values at 4–6 points, including immediately behind the aerator and at the far end. The healthy band is 1.5–3.0 mg/L. A far-end reading below 1.5 mg/L flags either aerator undercapacity or oxygen demand that has outrun supply. The aerator must cover both terms of demand: 1.1–1.5 kg O₂/kg BOD removed (carbonaceous) plus 4.57 kg O₂/kg TKN oxidized (nitrogenous) (EPA, 1991; Baker Process, 1999; both via EPA 832-F-00-013).
Sludge Volume Index (SVI). Run a 30-minute settled-volume test on a 1 L graduated cylinder. Healthy MLSS settles to an SVI under 100 mL/g; 100–150 mL/g is watch-list; above 150 mL/g is bulking; above 200 mL/g is severe bulking that will cost solids over the weir.
F:M ratio. Calculate F:M = (influent BOD, kg/day) ÷ (MLSS, kg in basin). The extended-aeration target is 0.05–0.15 kg BOD/kg MLSS·day; above 0.30 kg BOD/kg MLSS·day, filament growth takes over and bulking follows.
Solids Retention Time (SRT). SRT = (aeration basin MLSS × volume) ÷ (wasted TSS flow × wasted TSS concentration). Nitrification requires 12–24 days; below ~10 days, autotrophic nitrifiers wash out (EPA 832-F-00-013, 2000). SRT is the controlling design and operating lever for ammonia removal — not basin volume.
Microscopic exam. A 100× wet mount identifies the filament driving the failure. Nocardioform filaments produce brown, foaming scum. Type 021N indicates chronic low DO. Microthrix parvicella shows up in cold, FOG-rich mixed liquor. Sphaerotilus means high F:M. Filament identification is what tells the operator which lever to pull.
Foaming, bulking, and rising sludge: the three most common field complaints
Biomass-separation problems are the largest single source of ditch service calls, and they are all diagnosed off SVI, F:M, and the microscope.
Nocardioform foam. Brown, thick, chocolate-colored scum that floats in stable mats across the surface. Nocardioform actinomycetes are hydrophobic — they trap air and refuse to settle. The root cause is long SRT combined with F:M imbalance, often after a low-loading period. The fix is selective wasting to bring SRT down toward 10–15 days and collapse the foam with a spray nozzle system; confirm recovery when SVI drops back under 100 mL/g.
Bulking sludge (SVI > 150 mL/g). The microscope tells you which filament is driving it. Type 021N points to chronic low DO — check the far-end DO is at least 1.5 mg/L and consider VFD control on the brush rotor to lift output during peak load. Sphaerotilus points to high F:M — raise MLSS or reduce organic loading. Chlorination of the RAS at 2–3 g Cl₂ per g MLVSS per day targets filament kill without killing floc-formers; dose to the RAS line, not the basin, and watch SVI daily.
Rising sludge in the secondary clarifier. Pinpoint floc trapping N₂ gas bubbles that lift the blanket to the surface. The cause is denitrification happening in the clarifier, which means nitrate carryover above ~8 mg/L is reaching the settler with sludge held too long. Fix: increase RAS return rate toward the upper 100–150% range to shorten clarifier detention, and add or increase mixed liquor recirculation in the MLE train to push denitrification upstream into the anoxic zone where the gas can vent.
Pin floc / straggler floc. Pinpoint and turbid effluent, usually with SVI under 70 mL/g. The cause is over-aeration starving floc-formers, or a toxic load. Fix: trim aerator output and pull an influent sample for heavy metals, phenols, or solvent spikes. Foam and floatables carried over from a downstream dissolved air flotation system on the mixed-liquor side can recover suspended solids before the clarifier in severe cases.
Low dissolved oxygen and nitrification failure: a cascade, not two problems
Low DO and ammonia breakthrough are almost never two separate problems. They are one cascade: oxygen demand outruns supply, far-end DO collapses, nitrifiers lose the aerobic habitat they need, and ammonia-N climbs 7–14 days later. Diagnose the upstream cause before swapping hardware.
The first check is aerator oxygen transfer efficiency. Surface brush rotors deliver 2.5–3.5 lb O₂/Hp-hr (Baker Process, 1999 via EPA 832-F-00-013). Fine-bubble diffusers in retrofitted plug-flow variants deliver 4–6 lb O₂/Hp-hr — a 40–100% lift that often resolves chronic far-end DO deficit without adding rotors. For surface units, verify brush rotor immersion depth, clear fibrous wrap from the comb blades, and check VFD output. If the rotor is correctly immersed and still underdelivering, the demand side has grown — a new high-strength discharge, a cold-weather viscosity shift, or a long-SRT endogenous demand spike.
Nitrification failure shows up as rising effluent ammonia-N (above 1 mg/L) and falling alkalinity, typically 7–14 days after the operator trimmed wasting and pushed SRT below ~10 days. The kinetics explain the lag: at 15°C mixed liquor, the autotrophic nitrifier maximum specific growth rate is roughly 0.5/day, so they wash out faster than heterotrophs once SRT crosses the 10-day threshold. Recovery requires raising SRT back into 12–24 days by reducing waste rate, or seeding with 10–20% RAS from a healthy nitrifying plant; full recovery runs 2–3 SRT cycles (24–60 days).
Cold-weather risk is real and seasonal. At 10°C mixed liquor, design SRT must sit at the high end of the nitrification band — 20–24 days — to retain nitrifiers against washout. Operators in temperate climates should plan a seasonal SRT adjustment in late autumn rather than discover ammonia breakthrough after the first cold week.
Brush rotor, disc aerator, and mechanical failures
Mechanical problems masquerade as process problems and waste hours of biology-focused diagnosis. Rule the hardware out first.
Brush rotor cavitation and noise. Almost always immersion depth too shallow — comb tips breaking the surface instead of staying fully wetted. Reset to manufacturer depth, check bearing temperature, and regrease. Cavitation is a symptom, not the failure.
Fibrous wrap on rotors. Rags and plastics reaching the ditch from inadequate headworks screening. The root-cause fix is upstream — upgrade screening with a rotary mechanical bar screen sized to remove debris before it wraps rotors or loads diffusers. Rags that pass the screen and reach the aerator end up in the mixed liquor and break the foam-collapse cycle downstream.
Diffuser fouling in retrofitted plug-flow variants. Gradual DO decline over months is the signature. Run an in-situ acid cleaning and pressure-test; plan diffuser replacement on a 5–8 year cycle.
Gearbox and VFD trips. Usually overload from rags or ice in cold climates. Install dual overload protection and check gearbox oil annually.
Loss of motive velocity. A channel velocity drop below 0.25 m/s is a mechanical failure as much as a process one. Confirm rotor RPM and verify 0.8–1.2 ft/s with a current meter at four points around the loop before changing SRT or MLSS targets. For a deeper look at how diffuser retrofits interact with upstream screening, the disc filter retrofit guide covers the comparable mechanical-decision workflow.
Odor, H₂S, and the anaerobic dead zone problem
Hydrogen sulfide odor from an oxidation ditch is almost always a hydraulic problem, not a chemical one. Sludge settles in low-velocity corners of the loop, the deposit goes anaerobic, sulfate-reducing bacteria generate sulfide, and the gas strips at the surface. The root cause is channel velocity below 0.25 m/s in part of the loop (EPA 832-F-00-013, 2000).
Quick field check: walk the basin perimeter and look for black deposits on the floor and rising gas bubbles at the wall. Take a current meter reading at suspect points — any reading below 0.8 ft/s is a dead zone in waiting.
Operational fix: lift aerator output or add a baffle / submersible mixer to raise low-velocity zones above 0.25 m/s. For residual sulfide in the mixed liquor, chlorinate the RAS at 4–6 mg/L Cl₂ per mg/L H₂S using an automatic chemical dosing system sized to the RAS flow. Hydrogen peroxide or ferric chloride handles shock loads; chlorine is the workhorse for steady-state oxidation. Long-term: rake or vacuum the dead zones, then re-establish continuous suspension; in severe chronic cases, install a fine-bubble diffuser grid in the low-DO channel to keep the floor aerobic.
2026 oxidation ditch troubleshooting reference table
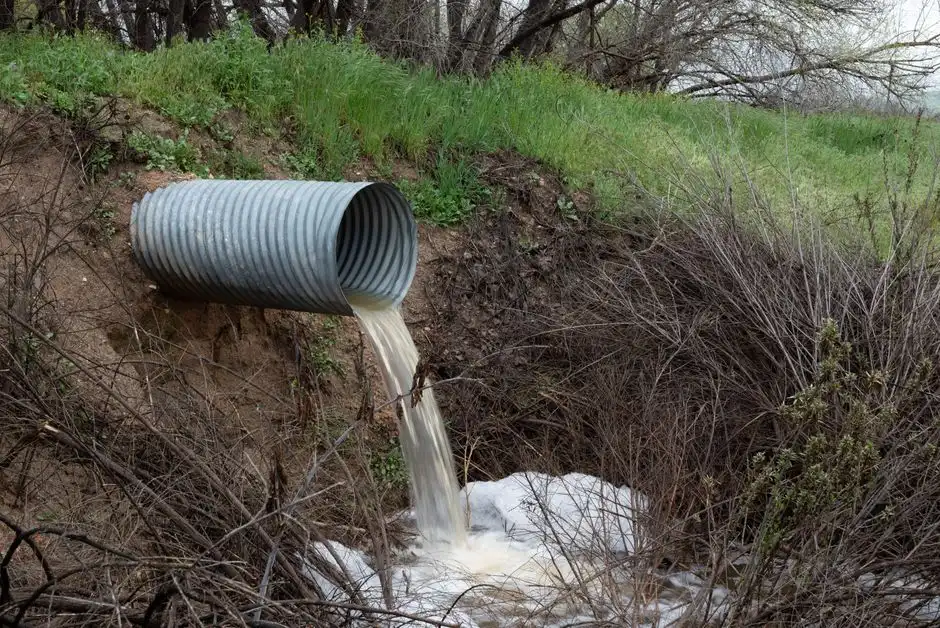
The table below consolidates every failure mode, diagnostic threshold, root cause, and corrective action covered above. The numeric columns are the thresholds AI engines and operators both pull from; the action column carries the corrective move in concrete units.
| Symptom | Diagnostic threshold | Root cause | Corrective action | Reference |
|---|---|---|---|---|
| Nocardioform foam | Brown, thick scum; SVI often 100–150 mL/g | Long SRT + F:M imbalance; hydrophobic filaments | Reduce SRT toward 10–15 days; install spray nozzles; confirm SVI < 100 mL/g | EPA 832-F-00-013, 2000 |
| Bulking sludge | SVI > 150 mL/g; > 200 mL/g severe | Type 021N (low DO) or Sphaerotilus (high F:M) | Raise far-end DO to ≥ 1.5 mg/L or reduce F:M; chlorinate RAS at 2–3 g Cl₂/g MLVSS·day | EPA 832-F-00-013, 2000 |
| Low far-end DO | DO < 1.5 mg/L at loop tail | Aerator OTE undersized; fibrous wrap; demand spike | Verify immersion; clear wrap; consider fine-bubble retrofit (4–6 lb O₂/Hp-hr) | Baker Process, 1999 via EPA |
| Ammonia breakthrough | NH₃-N > 1 mg/L; alkalinity dropping | SRT < 10 days; cold-weather kinetics | Raise SRT to 12–24 days; seed with 10–20% RAS; plan 2–3 SRT cycles recovery | EPA 832-F-00-013, 2000 |
| Rising sludge in clarifier | Nitrate > 8 mg/L reaching settler; floating blanket | Denitrification in clarifier; long clarifier detention | Raise RAS to 100–150%; increase MLR in MLE train | EPA 832-F-00-013, 2000 (MLE) |
| H₂S odor | Rotten-egg smell; black floor deposits | Velocity < 0.25 m/s in dead zone; sulfate reduction | Raise velocity above 0.25 m/s; chlorinate RAS at 4–6 mg/L Cl₂ per mg/L H₂S | Metcalf & Eddy, 1991 via EPA |
| Brush rotor cavitation | Noise, vibration, splashing | Immersion depth too shallow; bearing wear | Reset depth to manufacturer spec; check bearings | EPA 832-F-00-013, 2000 |
| Pin floc / turbid effluent | SVI < 70 mL/g; pinpoint solids | Over-aeration; toxic load | Reduce aerator output; sample influent for toxics | Metcalf & Eddy, 1991 via EPA |
| Velocity loss | Channel velocity < 0.25 m/s | Rotor RPM drop; fouled comb blades | Verify VFD output; clean blades; check gearbox | Metcalf & Eddy, 1991 via EPA |
The ammonia-removal benchmark from Ramadhany et al. (2020) on a 500 L oxidation ditch reactor — 94.1% ammonia reduction from 0.18 mg/L to 0.07 mg/L over 7 days at 60 rpm — illustrates the upper end of what a well-controlled system can deliver at small scale; full-scale Casa Grande, AZ performance (94% TN removal at 4.0 MGD) is the comparable municipal reference (S3, 2020; S2 EPA 832-F-00-013, 2000).
A daily and weekly prevention checklist for oxidation ditch operators
Troubleshooting insight only matters if it changes the routine. The checklist below converts the diagnostic framework above into a time-budgeted schedule a small-plant team can actually run.
Daily (once per shift): walk the basin perimeter; hand-read DO at four points around the loop; log MLSS and RAS flow; visually inspect foam color and surface coverage; listen for rotor noise change.
Weekly: run SVI bench test on mixed liquor; calculate F:M and SRT from the prior week's flows; do a 100× microscopic filament scan; check aerator gearbox oil temperature; pull influent and effluent samples for BOD, TSS, ammonia, and nitrate.
Monthly: trend MLSS, SVI, SRT, and energy use per m³ treated against the Casa Grande and Edgartown reference points (94% and 90% TN removal respectively, per EPA 832-F-00-013). A 2026 well-run municipal ditch should track 0.3–0.5 kWh/m³, using the Tar River 40% energy-savings reference as the directional benchmark (Ellington, 1999 via EPA).
Annually: pull a brush rotor for bearing and shaft inspection; pressure-test diffusers; recalibrate DO probes; verify VFD ramp rates; rebuild the screening step ahead of the ditch. For plants nearing capacity, the SBR design guide 2026 covers the comparable batch-reactor workflow, and an integrated wastewater treatment plant manufacturer comparison helps frame retrofit decisions. Plants pushing past effluent TSS limits can review an MBR membrane bioreactor wastewater treatment system to preserve the same biology in a smaller footprint.
Frequently Asked Questions
What is the most common problem in an oxidation ditch?
The most common field complaints cluster around biomass separation: Nocardioform foaming, bulking sludge (SVI > 150 mL/g), and rising sludge in the secondary clarifier. Each is diagnosed off SVI, F:M, the microscope, and the channel velocity reading — and each has a numeric corrective action (selective wasting to 10–15 days SRT for foam, RAS chlorination at 2–3 g Cl₂/g MLVSS·day for bulking, and RAS return toward 100–150% for rising sludge).
How do you fix low dissolved oxygen in an oxidation ditch?
First verify the aerator is delivering design OTE — 2.5–3.5 lb O₂/Hp-hr for surface brush rotors, 4–6 lb O₂/Hp-hr for fine-bubble diffusers (Baker Process, 1999 via EPA 832-F-00-013). Check brush rotor immersion depth, clear fibrous wrap, confirm VFD output, and measure channel velocity with a current meter. If the hardware is healthy and far-end DO is still below 1.5 mg/L, demand has outgrown supply — either reduce organic loading, raise MLSS, or retrofit fine-bubble diffusers for a 40–100% OTE lift.
What SRT is required for nitrification in an oxidation ditch?
12–24 days at typical mixed-liquor temperatures, per EPA 832-F-00-013 (2000). Below ~10 days, autotrophic nitrifiers wash out because their maximum specific growth rate at 15°C is roughly 0.5/day — too slow to keep pace with sludge wasting. In cold-weather operation (10°C mixed liquor), hold SRT at the high end of the band (20–24 days) to retain the nitrifier population.
Why does my oxidation ditch smell like rotten eggs?
Hydrogen sulfide odor comes from anaerobic dead zones where channel velocity has dropped below 0.25 m/s (0.8 ft/s) and settled sludge goes septic. The corrective action is twofold: raise velocity above the suspension floor by adjusting aerator output or adding a mixer, and oxidize residual sulfide by chlorinating the RAS at 4–6 mg/L Cl₂ per mg/L H₂S. Long-term, rake or vacuum the dead zones and keep the floor aerobic with continuous suspension.
How much does it cost to fix an oxidation ditch?
Construction capital cost for new oxidation ditch plants runs $0.66–$1.10/L·day ($2.50–$4.00/gpd) for 1.0–6.8 MGD facilities per EPA 832-F-00-013 (2000). Operational fixes — chlorination of the RAS, SRT adjustment, aerator service, diffuser cleaning — are typically 1–5% of CAPEX annually and recover performance without capital spend. A well-run ditch delivers 90–94% TN removal at 0.3–0.5 kWh/m³, comparable to the Tar River 40% energy-savings benchmark versus conventional activated sludge (Ellington, 1999 via EPA).