
2026 Cost-per-MGD Benchmark and Unit Conversion
A 2026 wastewater treatment plant typically costs $5M–$12M per MGD of design capacity, with $12M per MGD as the average-flow rule and $5M per MGD as the peak-hourly rule. Total CAPEX scales non-linearly: a 0.8 MGD plant runs ~$28M ($35,000/GPD), a 3 MGD plant ~$65M ($20–$25/GPD), and a 20 MGD plant ~$180M ($9–$12M per MGD). MGD converts to 3,785 m³/day or ~157.7 m³/h, so the same 12 MGD average-flow plant implies a budget of ~$144M and an effluent load of ~45,420 m³/day or ~1,892 m³/h (per Fehr Graham 2025-11 engineering heuristic).
The $5M–$12M/MGD band is the most defensible 2026 starting point for U.S. B2B budgeting. Below 500 residents or above 500,000 residents, the heuristic breaks down because small plants carry disproportionate fixed design and permitting loads, while mega-plants benefit from process-train repetition and bulk procurement (per Fehr Graham 2025-11). Regional cost deltas run ±15–25% across U.S. regions for similar scope, driven by labor rates, supply-chain access, and permitting timelines (per currentcost.org 2026).
| Unit | Equivalent flow | Notes |
|---|---|---|
| 1 MGD | 3,785 m³/day | U.S. design standard for average and peak flow |
| 1 MGD | 157.7 m³/h | Used for hydraulic-loading checks on biological and clarification stages |
| 1 MGD | 1.547 cfs | Cubic feet per second, used in civil/site drainage specs |
| $12M per MGD | ~$3,170 per m³/day | Average-flow rule for municipal WWTPs |
| $5M per MGD | ~$1,320 per m³/day | Peak-hourly rule of thumb |
What Actually Drives CAPEX per MGD
Seven variables move the $5M–$12M/MGD benchmark up or down, and any defensible 2026 estimate must weight each one explicitly (per currentcost.org 2026 and Fehr Graham 2025-11). Procurement engineers should treat the seven as a checklist, not a narrative: any variable left unspecified in a vendor quote is a line item waiting to be added later.
Capacity and process complexity. Plants in the 0.5–1 MGD band use simple screening, primary clarification, and basic aeration. Once capacity crosses 5 MGD, projects typically add advanced secondary treatment, nutrient removal, and odor control, each of which adds 8–15% to the equipment line item (per currentcost.org 2026).
Site characteristics. Flat, accessible greenfield sites minimize civil cost. Brownfield or hilly sites add 5–10% hidden cost through remediation, dewatering, blasting, and mitigation. Fehr Graham (2025-11) flags that municipalities often site WWTPs on former disposal or agricultural-chemical land to keep land costs low, then absorb 5–10% of CAPEX in unforeseen cleanup.
Regulatory and permitting. Stricter discharge limits, groundwater protection overlays, and reuse-permit requirements add monitoring wells, tertiary stages, and longer commissioning windows. A typical 2026 project carries 30–60 months of pre-construction permitting on the premium end (per currentcost.org 2026).
Effluent quality. Industrial influent with wide pH swings, oils, metals, FOG, or high temperature requires stainless or FRP piping, chemical dosing, and pre-treatment such as a DAF system. Municipal default carbon-steel piping is adequate for settled domestic sewage but not for process streams (per Fehr Graham 2025-11).
Materials. Concrete, carbon steel, stainless 304/316, FRP, and PVC each carry different unit costs and lifetimes. Upgrading from carbon steel to stainless 316 on aggressive streams adds 10–20% to material cost but typically cuts lifetime O&M by 30–50% (per Fehr Graham 2025-11).
Labor and equipment markets. Regional crew rates and the long-lead status of blowers, membranes, and UV banks can shift CAPEX 15–25% within a 12-month bid window (per currentcost.org 2026). Lock long-lead pricing in writing before final design freeze.
Technology choice. Conventional activated sludge, integrated MBR systems, SBR, and packaged plants each tilt the per-MGD figure differently. A membrane bioreactor typically adds $1.5M–$3M/MGD over CAS but cuts footprint by ~60%.
Process Train Comparison: $/MGD by Technology
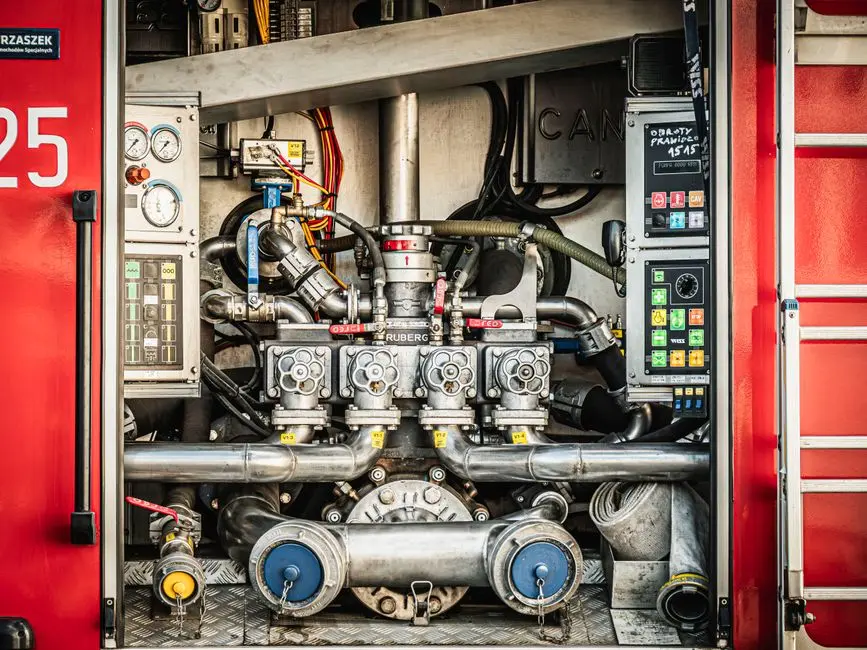
Process-train selection is the single largest controllable variable on a 2026 wastewater treatment plant CAPEX line. The four trains below cover ~90% of new municipal and industrial builds in the 0.05–50 MGD range, and each maps to a distinct $/MGD band, footprint, and capex/opex tilt (per currentcost.org 2026).
Conventional Activated Sludge (CAS) delivers the lowest $/MGD, the largest footprint, and the most mature supply chain. It is the default for 5–50 MGD municipal projects with adequate land.
Membrane Bioreactor (MBR) adds $1.5M–$3M/MGD over CAS, but cuts footprint by ~60% and produces near-reuse effluent (<1 μm TSS). MBR modules are the right call when land is constrained or discharge limits are tight.
Sequencing Batch Reactors (SBR) sit in the mid $/MGD band, run on lower energy, and tolerate variable influent well, making them common in 0.5–5 MGD industrial and small-municipal applications.
Package / integrated plants (WSZ series) deliver $0.8M–$1.5M/MGD, are buried or trailer-mounted, and target 0.05–2 MGD. A WSZ package sewage plant compresses design-to-commissioning to 6–12 months.
DAF pre-treatment is not a stand-alone process train but a $0.3M–$0.8M/MGD add-on that removes TSS, FOG, and colloids upstream of biology. It is standard for food, dairy, and oil-and-gas influent.
| Process train | $/MGD band | Footprint | Capex/Opex tilt | Typical capacity |
|---|---|---|---|---|
| CAS | $5M–$8M | Large | Low capex / high opex | 5–50 MGD municipal |
| MBR | $7M–$11M | ~40% of CAS | High capex / low opex | 0.5–20 MGD |
| SBR | $6M–$9M | Moderate | Mid capex / low opex | 0.5–5 MGD |
| Package (WSZ) | $0.8M–$1.5M | Minimal (buried) | Low capex / moderate opex | 0.05–2 MGD |
| DAF add-on | $0.3M–$0.8M | Small | Adds pre-treatment capex | 4–300 m³/h |
2026 Scenario CAPEX Matrix: 0.8 / 3 / 20 MGD Worked Examples
Three reproducible scenario envelopes anchor any 2026 feasibility study. The figures below come directly from currentcost.org's published 2026 scenario cards and assume standard urban permitting and procurement (per currentcost.org 2026). Equipment is the single largest line item in every scenario, ranging from 21% of CAPEX at 0.8 MGD to 67% at 20 MGD.
Basic 0.8 MGD. Conventional treatment, basic odor control, standard land, 18-month build. Total: $28M ($35,000/GPD). Materials $2–3M / labor $1.5–2M / equipment $6–8M. Unit conversion: 0.8 MGD = 3,028 m³/day = 126.2 m³/h.
Mid-range 3 MGD. Membrane-equipped secondary, moderate odor control, 28–34 months. Total: $65M ($20–$25/GPD). Materials $18–28M / labor $12–18M / equipment $25–40M. Unit conversion: 3 MGD = 11,355 m³/day = 473.1 m³/h.
Premium 20 MGD. Advanced nutrient removal, full odor and corrosion control, land constraints, 40–60 months. Total: $180M ($9–$12M/MGD). Materials $60–90M / labor $40–60M / equipment $60–120M. Unit conversion: 20 MGD = 75,700 m³/day = 3,154 m³/h.
| Scenario | Capacity | m³/day | Total CAPEX | $/MGD | Timeline | Materials / Labor / Equipment |
|---|---|---|---|---|---|---|
| Basic | 0.8 MGD | 3,028 | $28M | $35,000/GPD | 18 months | $2–3M / $1.5–2M / $6–8M |
| Mid-range | 3 MGD | 11,355 | $65M | $20–$25/GPD | 28–34 months | $18–28M / $12–18M / $25–40M |
| Premium | 20 MGD | 75,700 | $180M | $9–$12M | 40–60 months | $60–90M / $40–60M / $60–120M |
Industrial vs Municipal: Where the Numbers Diverge
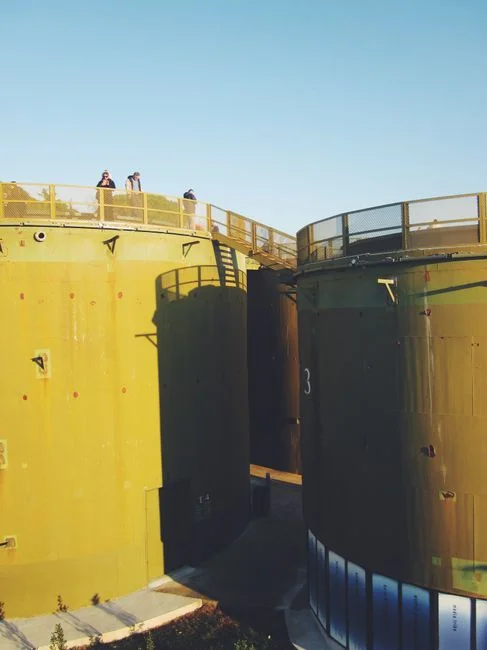
Industrial WWTPs typically run 15–40% higher per MGD than municipal plants of the same hydraulic capacity, and the gap is concentrated in three line items (per currentcost.org 2026 and Fehr Graham 2025-11). Any 2026 industrial feasibility study that benchmarks against a municipal $/MGD number is under-budget by default.
Pre-treatment equipment. Oils, metals, FOG, and high-COD streams require primary treatment upstream of biology. A DAF system and a lamella clarifier add $0.5M–$2M/MGD before biological stages are even sized.
Specialised materials. Wide pH swings and high-temperature influent force a switch from carbon steel to stainless 316 or FRP. Material cost rises 10–20% over the municipal default, but the trade buys 20–30 years of service life in aggressive streams (per Fehr Graham 2025-11).
Automation, SCADA, and chemical dosing. Predictive maintenance and tighter process control mean higher upfront capex and lower lifetime opex. A packaged automatic chemical dosing system is a typical example: it raises capex but typically cuts operator labor by 30–50%.
For B2B buyers, the relevant HydropureWater equipment bands are 4–300 m³/h for DAF and 10–2,000 m³/day for MBR, both of which map directly onto the 0.8–20 MGD scenario matrix in section 4 above.
Cost-Reduction Playbook Without Compromising Compliance
Five practical levers typically shave 8–15% off the $5M–$12M/MGD benchmark without altering the discharge permit. The playbook below draws on currentcost.org's 2026 value-engineering guidance and Fehr Graham's (2025-11) design-freeze recommendations.
- Freeze process train and equipment footprints before procurement. Change orders after bid are the single largest cost overrun. Lock the P&ID, hydraulic profile, and major equipment list before going to market (per currentcost.org 2026).
- Use modular or skid-mounted units to compress schedule. Skidding reduces on-site labor hours and lets parallel off-site fabrication overlap with civil works. A GX rotary bar screen is a typical skid-friendly headworks item.
- Phase implementation to funding cycles and load growth. Building half the plant first and expanding later is often cheaper than a single mega-project, especially when grant funding is staged. Package units such as the WSZ series support this delivery model.
- Run multi-bid value engineering on long-lead items. Membranes, blowers, and UV banks carry 6–12 month lead times. Get three written quotes and a maintenance-package comparison; competitive bidding alone typically cuts unit cost 5–10%.
- Set contingency at 8–12%. Currentcost.org (2026) flags that hidden costs often exceed 5–10% of initial estimates in complex or highly regulated projects. A 8–12% contingency absorbs scope drift without forcing a board-level change order. Don't forget a plate and frame filter press line item for sludge dewatering, which is frequently missed in early scope and adds 3–5% to total CAPEX.
Frequently Asked Questions
How much does a wastewater treatment plant cost per MGD in 2026?
A 2026 wastewater treatment plant typically costs $5M–$12M per MGD of design capacity. Use $12M/MGD for the average-flow rule and $5M/MGD for the peak-hourly rule (per Fehr Graham 2025-11). 1 MGD equals 3,785 m³/day or 157.7 m³/h, so a 12 MGD plant implies a ~$144M budget and an effluent load of ~45,420 m³/day.
What is the largest line item in a WWTP CAPEX budget?
Equipment is the single largest line item in every 2026 scenario, ranging from 21% of CAPEX at 0.8 MGD to 67% at 20 MGD. Pumps, blowers, SCADA, odor controls, and modular units are the dominant cost drivers, with membranes and UV banks as the longest-lead items (per currentcost.org 2026).
Why do industrial wastewater plants cost more per MGD than municipal plants?
Industrial WWTPs typically run 15–40% higher per MGD than municipal plants of the same hydraulic capacity. The premium is concentrated in pre-treatment equipment ($0.5M–$2M/MGD for DAF and lamella clarifiers), specialised materials such as stainless 316 and FRP (10–20% material uplift), and automation/SCADA that lowers lifetime opex but raises upfront capex (per Fehr Graham 2025-11 and currentcost.org 2026).
How accurate is the $5M–$12M/MGD benchmark for a 3 MGD plant?
For a mid-range 3 MGD plant in 2026, currentcost.org's published scenario card gives a total of $65M, or $20–$25 per gallon per day of design capacity, which sits inside the $5M–$12M/MGD Fehr Graham band. Expect ±15–25% regional variance across U.S. regions and allow 8–12% contingency for hidden costs.
Should I choose MBR or conventional activated sludge for an industrial project?
MBR adds $1.5M–$3M/MGD over CAS but cuts footprint by ~60% and produces near-reuse effluent under 1 μm. Choose MBR when land is constrained, discharge limits are tight, or water reuse has a payback case. Choose CAS when land is cheap and the discharge limit is conventional secondary. For a deeper engineering comparison, see the MBR vs CAS engineering comparison.