Hopewell Chemicals Plants Face a 2026 MBR-or-CAS Decision
For Hopewell, VA chemicals plants in 2026, MBR is the better choice when reuse, recalcitrant influents, or a 60% smaller footprint drives the spec; CAS remains competitive when land is available and discharge to the James River or Hopewell POTW has permit headroom. MBR delivers TSS <5 mg/L and turbidity <1 NTU at SRT 20-60 days versus CAS at 10-30 mg/L TSS and SRT 5-15 days, but carries 1.4-1.8× the CAPEX and 1.2-1.5× the OPEX of a comparable CAS train. Reuse credits of $1.50-3.00/m³ typically close the OPEX crossover inside 5-8 years for a 1,000-5,000 m³/day plant.
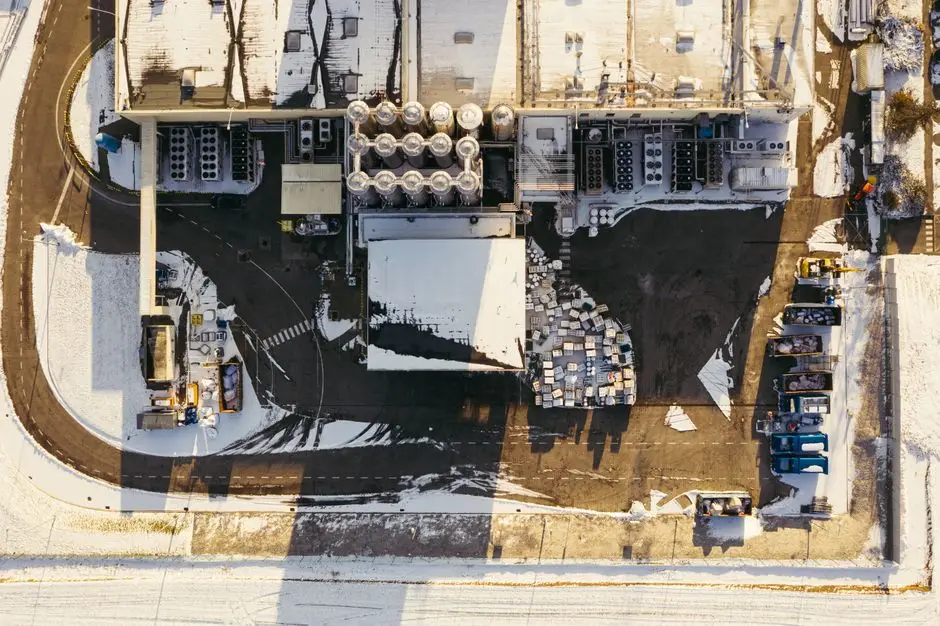
Hopewell's petrochemical corridor along the James River — anchored by AdvanSix (caprolactam and ammonium sulfate), DuPont Spruance (Kevlar/ Nomex intermediates), and the Hercules legacy site (now part of Solenis) — produces a chemicals envelope that regularly swings COD 800-4,000 mg/L, throws surfactant and solvent slugs, and pushes pH and chloride excursions far beyond municipal envelopes. The 2025-2026 VPDES permit reissuance cycle at Hopewell chemical outfalls is tightening whole-effluent toxicity (WET) limits and adding PFAS precursor scan monitoring, forcing a procurement decision that has to survive a 20-year permit horizon rather than a 2026 sticker price. For a frame-by-frame comparison of the same decision in a Central US corridor, see the parallel MBR vs CAS for chemicals wastewater in East Saint Louis 2026 guide. The central trade-off is unchanged: MBR delivers near-reuse-grade effluent at higher CAPEX/OPEX, while CAS remains dominant worldwide because of its century-long operating history when SVI stays below 150 mL/g.
How Each Technology Treats a Chemicals Stream
CAS treats chemicals wastewater by growing a bacterial-protozoan consortium in an aeration basin at SRT 5-15 days and HRT 6-12 hours, then separating cleaned water from biomass in a downstream clarifier whose performance is tied directly to sludge settleability. A 10-day SRT, 8-hour HRT train on a 2,500 mg/L COD feed typically produces Yobs 0.30-0.45 kg VSS/kg COD and effluent TSS 10-30 mg/L when settleability holds. Surfactant batches, solvent washdowns, and ammonia shocks trigger bulking, pinpoint floc, and clarifier upsets — polymer dose climbs, blanket washes over the weir, and the plant loses hydraulic capacity for the day.
An MBR uses the same biological stage but replaces the clarifier with a submerged DF-series flat-sheet membrane module in 0.1-0.4 μm PVDF, operating at SRT 20-60 days, MLSS 8,000-15,000 mg/L, and flux 10-25 LMH. The 0.1-0.4 μm pore rating physically retains all floc regardless of SVI, so a 30-day SRT MBR on the same 2,500 mg/L COD feed typically drops to Yobs 0.10-0.25 kg VSS/kg COD and TSS <5 mg/L on the permeate side. The high SRT is the technical advantage for chemicals streams: slow-growing nitrifiers and PAH/SVOC degraders that wash out of a 10-day CAS train stay in the bioreactor. Operating on the James River, where January mixed liquor drops to 6-10 °C, that retention differential is what keeps full nitrification online through the winter — the topic of MBR vs CAS for chemicals wastewater in Monticello in colder corridors covers the same winter-kinetics argument for a colder site.
Effluent Quality, Footprint, and Microplastic Removal
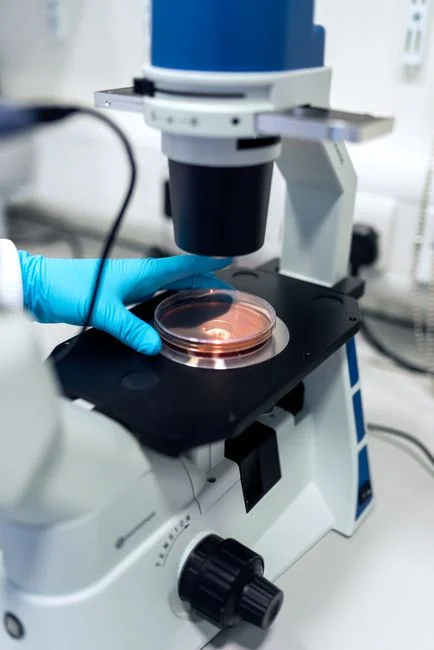
MBR effluent quality is set by a physical barrier; CAS effluent quality is set by a settling process that drifts the moment SVI rises. MBR typically holds TSS <5 mg/L and turbidity <1 NTU on a Hopewell chemicals feed regardless of clarifier hydraulics, while CAS moves between 10 and 30 mg/L TSS at best and degrades sharply during a bulking event. For a chemicals plant targeting cooling-tower makeup, scrubber dilution, or RO/IX-polished boiler feed, MBR permeate is meaningfully closer to reuse-grade than clarified CAS overflow.
The microplastic argument is where MBR pulls further ahead in a 2026 buyer memo. Peer-reviewed data from PMC reports that an MBR+RO train achieves 93.2% microplastic removal versus 86.14% for a classical activated-sludge system on a polyethylene-dominated feed, and that submerged 0.1 μm MF alone drives influent from 81-106 MP/L down to 1-2 MP/L, a 98-100% reduction (PMC, 2025-02). On footprint, an integrated MBR skid packages bioreactor and submerged cassettes in one envelope and runs roughly 60% smaller than a CAS layout because the secondary clarifier and most tertiary filtration are eliminated — the difference between a feasible Hopewell brownfield retrofit and a civil expansion that triggers a new VPDES major-modification review.
Master Parameter Table: MBR vs CAS for a Hopewell Chemicals Plant
The table below condenses the operating envelope an engineer needs to defend an MBR or CAS spec to a Hopewell procurement committee. Values are drawn from the Central US chemicals baseline (S2) and the PMC microplastics dataset (S4); Hopewell-specific design values must be confirmed against current influent testing and the VPDES permit.
| Parameter | CAS | MBR (submerged PVDF) |
|---|---|---|
| MLSS (mg/L) | 2,000-4,000 | 8,000-15,000 |
| SRT (days) | 5-15 | 20-60 |
| HRT (hours) | 6-12 | 4-8 |
| Observed yield Yobs (kg VSS/kg COD) | 0.30-0.45 | 0.10-0.25 |
| Effluent TSS (mg/L) | 10-30 | <5 |
| Effluent turbidity (NTU) | 2-15 | <1 |
| Membrane pore (μm) | n/a | 0.1-0.4 |
| Scouring aeration (m/s) | n/a | 0.1-0.3 crossflow |
| Footprint factor vs CAS = 1.0 | 1.0 | ~0.4 |
| Microplastic removal (%) | ~86.1 (PE-dominant feed) | 93.2 (MBR+RO); 98-100 (0.1 μm MF alone) |
For a Hopewell chemical plant picking the cassette stage on a brownfield retrofit, the DF-series flat-sheet module is the membrane element those rows reference.
Winter Performance and Slug Resilience on the James
Hopewell January mixed-liquor temperatures run 6-10 °C, and nitrification rate roughly halves per 10 °C drop on either train. The operating consequence is concrete: a 10-day SRT CAS at 10 °C typically cannot sustain full nitrification, while a 30-day SRT MBR at the same temperature does — the MBR's enclosed tank and physical barrier decouple hydraulic cold-shock from biomass retention in a way a clarifier cannot. The same physics governs slug resilience: a surfactant batch or solvent washdown that crashes a clarifier in CAS only drops MLSS activity in an MBR, because the 0.1-0.4 μm membrane holds the biomass in the basin while the operator walks the spike off. MBR effluent TSS stays flat through such events; CAS effluent TSS spikes and Hauling costs rise with the polymer dose to recover. For Hopewell streams carrying surfactant or solvent slugs, specify the DF-series flat-sheet membrane module for the flat-sheet geometry's tolerance of these events.
CAPEX, OPEX, and the Reuse Crossover
For a 1,000 m³/day Hopewell chemicals stream in 2026 dollars, MBR carries 1.4-1.8× the CAPEX of a comparable CAS train and 1.2-1.5× the OPEX per cubic meter treated; CAS OPEX runs $0.15-0.30/m³ versus MBR at $0.25-0.50/m³ (S2). The fouling OPEX layer is the structural delta: weekly NaOCl 500-1,000 mg/L maintenance cleans, semi-annual citric acid or NaOH recovery cleans, continuous scouring aeration at 0.1-0.3 m/s crossflow, and 0.3-0.6 kWh/m³ of blower energy above the CAS baseline. Against that, the savings layer is real: 20-40% lower sludge yield plus biosolids hauling at $35-55/wet ton over 100+ km drive six figures of OPEX avoided across the 20-year horizon at 1,000-5,000 m³/day.
| Cost axis (1,000 m³/day, 2026 directional) | CAS | MBR |
|---|---|---|
| CAPEX multiplier vs CAS baseline | 1.0× | 1.4-1.8× |
| OPEX ($/m³ treated) | 0.15-0.30 | 0.25-0.50 |
| Scouring aeration above baseline (kWh/m³) | — | 0.3-0.6 |
| Membrane replacement (% CAPEX/yr) | — | ~3-5% |
| Sludge yield (kg VSS/kg COD) | 0.30-0.45 | 0.10-0.25 |
| Sludge hauling ($/yr at 1,000 m³/d, >100 km) | Higher baseline | 20-40% lower via yield |
What flips the answer for a chemicals plant is reuse revenue. When MBR permeate displaces purchased process water at $1.50-3.00/m³ or supplies boiler feed after RO polishing, the OPEX crossover shrinks from decades into the 5-8 year band; the math is laid out in the MBR cost per m³ 2026 guide using the same directional numbers.
Decision Matrix and Retrofit Path for Hopewell

The 5-row matrix below is designed to be marked up in a Hopewell recommendation meeting. If the site scores in the MBR column on three or more rows, the procurement package should be written around an MBR or an MBR-retrofit train.
| Decision row | Choose CAS | Choose MBR (or membrane retrofit) |
|---|---|---|
| Discharge destination | Discharge to POTW or surface water with permit headroom | Reuse (cooling, scrubber, boiler feed after RO/IX) |
| Land envelope | Land available, civil expansion feasible | Tight brownfield, civil expansion constrained |
| Influent character | Readily biodegradable, low recalcitrant load | Recalcitrant SVOCs, high salinity, pH swings, slug events |
| Regulatory trend | Stable limits, no PFAS/microplastic monitoring | Tightening WET, PFAS precursor scan, microplastic monitoring |
| Biosolids economics | Short haul (<50 km), land application or landfill | Long haul (>100 km), hauling cost significant |
For a Hopewell chemicals plant that already runs CAS and needs reuse quality, the lowest-risk path is a hybrid retrofit: keep the existing aeration basin and clarifier in service and add a membrane cassette stage downstream. Either train still requires the same pretreatment envelope — equalization, pH control, oil/water separation — and a plate-and-frame filter press downstream of either biology train typically dewaters to 22-28% DS for Class B disposal (S2).
Frequently Asked Questions
When does MBR beat CAS for a Hopewell chemicals plant under a 2026 VPDES reissuance?
When three or more of the following are true: the plant targets reuse (cooling tower, scrubber, boiler feed after RO/IX), the brownfield is footprint-constrained, the influent carries recalcitrant SVOCs or surfactant/solvent slugs, the VPDES permit is tightening WET or adding PFAS precursor scan monitoring, and biosolids haul exceeds 100 km. Below that threshold, CAS with stable SVI is the cheaper 20-year answer (S2).
How much smaller is an MBR than a CAS train at 1,000-5,000 m³/day?
MBR footprint runs roughly 40% of a comparable CAS layout, because the secondary clarifier and most tertiary filtration are eliminated and MLSS climbs to 8,000-15,000 mg/L versus 2,000-4,000 mg/L in CAS (S2, S6). On a Hopewell brownfield, that delta is the difference between an in-place retrofit and a civil expansion.
What does MBR microplastic removal look like versus CAS for a Hopewell effluent envelope?
PMC peer-reviewed data reports 93.2% microplastic removal for an MBR+RO train versus 86.14% for a classical activated-sludge system on a polyethylene-dominated feed, and 98-100% reduction (81-106 MP/L down to 1-2 MP/L) for a 0.1 μm submerged MF stage alone (PMC, 2025-02). For a 2026 Hopewell permit facing a tightening WET envelope, that gap is a defensible number in the buyer memo.