Four Symptoms That Signal a Fenton System Is Underperforming
Fenton oxidation system troubleshooting reduces to four field readings: reactor pH (2.8–3.2), H2O2:Fe molar ratio (100–1,000), residual peroxide after the design contact time, and Fenton sludge dry solids produced per kg COD removed. When COD removal drops more than 20 percentage points below the jar-test pilot and residual H2O2 is still elevated at the outlet, hydroxyl radical scavenging is the dominant cause—chloride, bicarbonate, and chelating organics convert ·OH into much weaker oxidants (S4). A textile dyehouse pilot running 10 m³/h at ~1,200 mg/L COD and 60 mg/L Fe²⁺ measured peroxide demand roughly 30% above stoichiometry for exactly this reason (S4).
Brown foam and a temperature spike within the first minute of H2O2 dosing point to catalytic decomposition—peroxide is breaking down to O2 and water instead of generating ·OH, usually because suspended solids are shielding iron or pH has drifted above 4 (S4). A clear effluent with COD unchanged tells the operator that Fe³⁺ is not being reduced back to Fe²⁺ fast enough to sustain the catalytic cycle, common when alkalinity is high or the matrix has little organic buffering to drive the Fenton-like side reactions (S4, S5). Finally, sludge volume running 30%+ above design usually means the iron dose is too high or neutralization is overshooting pH 9–10, both of which convert Fe(OH)₃ into gelatinous solids that punish the dewatering press (S4). A landfill leachate pilot documented the same pattern: reagent demand climbed sharply during rainy-season influent swings because chloride and alkalinity loads spiked together (S4).
Diagnosing pH Drift and Its Effect on Hydroxyl Radical Yield
Optimal Fenton pH is approximately 3.0, and the window is narrow: below 2.5, [Fe(H2O)6]²⁺ dominates and the reaction with H2O2 slows; above ~4, iron precipitates as Fe(OH)₃ and stops catalyzing peroxide decomposition entirely (S5). A drift of just 0.5 pH units can halve COD removal in real wastewater matrices, making manual 2-hour grab sampling inadequate on a full-scale reactor.
Install an online pH probe with auto-dosing of H2SO4 and NaOH, and log the signal to SCADA at 4–20 mA. When influent alkalinity is high (above ~500 mg/L CaCO₃), dose the acid upstream of the Fenton reactor in a dedicated equalization tank, not inside the reactor, to avoid localized Fe(OH)₃ plating on the injection nozzle or the electrode (S4). A PLC-controlled acid and Fe²⁺ dosing system with closed-loop pH control typically holds the reactor inside the 2.8–3.2 window with ±0.1 unit deviation.
Field tip: if pH will not stay below 3.5 even with continuous acid feed, alkalinity destruction is the bottleneck. Switch to a two-stage reactor—first stage for alkalinity destruction at pH 4, second stage for Fenton at pH 3—to cut total acid consumption while keeping iron in solution (S4).
Reading the Numbers: Residual H₂O₂, ORP, and Fenton Sludge Volume
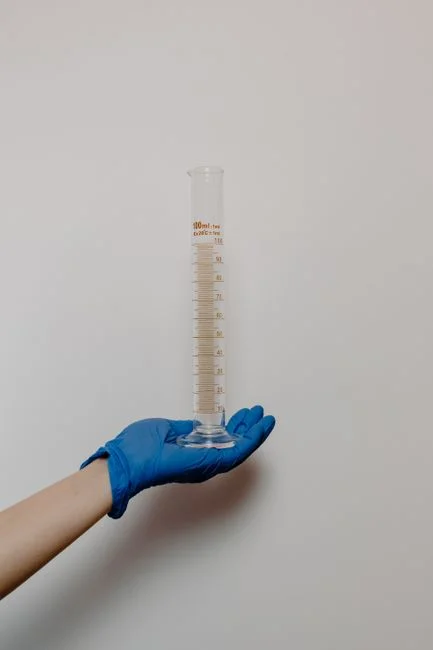
The three measurements that turn a Fenton reactor from a black box into a diagnostic instrument are residual H2O2, ORP, and the dry-solids yield of the neutralization sludge. Measure residual H2O2 at the reactor outlet with a DPD colorimetric test or a standard titration; a residual above ~200 mg/L after the design contact time means either the dose is excessive, contact time is too short, or scavenging is so severe that ·OH never formed in the first place (S4). In a scavenging-dominated matrix the residual reads high while COD barely moves—that combination is the smoking gun.
ORP should rise sharply to +400 to +600 mV within 5 minutes of H2O2 addition; a sluggish ORP curve signals insufficient Fe²⁺ or pH outside the 2.8–3.2 window. Pair the ORP trace with the pH trace on the same time axis to determine within one batch whether the failure is dosing or chemistry.
Iron sludge from neutralization should settle within 30–60 minutes in a lamella or DAF thickener; if it stays colloidal for hours, suspect complexing agents—EDTA, citrate, or high-strength dye auxiliaries—that lock iron as soluble Fe-organic species and carry it into the clarifier overflow (S4). On the budget side, plan for 1.5–2.5 kg dry solids per kg of Fe²⁺ dosed. A plant dosing 60 mg/L Fe²⁺ at 10 m³/h generates roughly 25–40 kg DS/h of Fenton sludge (derived from S4 textile pilot figures), and the dewatering press—typically a plate-and-frame filter press for Fenton sludge dewatering—is the equipment that decides whether the chemistry is economic. For a deeper look at press selection, see this sludge dewatering system working principle guide.
Quick-Reference Parameter Table for Fenton System Settings
Use this table to match a current reading to a documented best-practice target in under a minute. Values are drawn from S4 (field pilot data) and S5 (peer-reviewed photo-Fenton review).
| Parameter | Target Range | Common Fault | Corrective Action |
|---|---|---|---|
| Reactor pH | 2.8–3.2 (S5) | Drift above 3.5 from high alkalinity | Pre-acidify in equalization; add NaOH-controlled two-stage reactor |
| H2O2:Fe molar ratio | 100–1,000 (S5); 2–150 conventional photo-Fenton (S5) | Residual H2O2 >200 mg/L after contact | Reduce H2O2 dose, increase Fe²⁺ modestly, switch to staged dosing |
| H2O2:COD mass ratio | 1.0–3.5 for photo-Fenton; ~3.0 mg/mg COD textile batch (S4, S5) | Peroxide demand 30%+ above stoichiometry | Add chloride/alkalinity jar-test series; pre-treat for scavengers |
| Contact time | 30–90 min (S4) | COD flat, color gone | Extend to 90 min or switch to photo-Fenton if UVT >50% |
| Fe²⁺ dose | 20–80 mg/L typical; 60 mg/L textile pilot (S4) | Sludge volume 30%+ above design | Drop Fe²⁺ to 30–40 mg/L; confirm neutralization pH 7–8 |
| Mixing G value | 200–500 s⁻¹ | Brown foam, peroxide stripping | Reduce impeller speed; switch to pitched-blade turbine |
Fixing the Four Most Common Fenton Process Problems
Problem 1 — low COD removal with high residual H2O2: hydroxyl radical scavenging is the dominant cause. Cut the H2O2 dose by 20%, raise Fe²⁺ modestly to the 60–80 mg/L range, and run a chloride/bicarbonate jar-test series across three influent composite samples. Replace single-shot peroxide dosing with 3–4 staged shots across the first 30 minutes of contact; this keeps the local ·OH concentration in the productive range and reduces recombination losses (S4).
Problem 2 — sludge volume blowing the dewatering budget: drop Fe²⁺ to 30–40 mg/L and verify the neutralization stage is landing at pH 7–8, not 9–10. Above pH 9 the sludge picks up calcium and magnesium hydroxides that blind the filter cloth and cut cycle throughput. A DAF pre-treatment before the Fenton reactor also helps: it strips suspended solids that would otherwise carry iron downstream and inflate sludge mass. For sites with high influent TSS, a high-efficiency sedimentation tank upstream of the Fenton stage is a cheaper alternative.
Problem 3 — clear effluent but COD unchanged: Fe³⁺ reduction is rate-limiting. Extend contact time to 90 min if hydraulic residence allows, or move to photo-Fenton when UV transmittance above the reactor exceeds 50%—S5 lists photo-Fenton as a Best Available Technique for textile wastewater for exactly this case. Electro-Fenton and UVC/H2O2 variants are options where the site can absorb the higher capital cost (S5).
Problem 4 — reagent demand rising during wet weather: influent chloride and bicarbonate are loading in with stormwater, and each unit of chloride can push peroxide demand by 1–2%. Pre-treat with equalization (24-hour basin) and a DAF or lamella clarifier to strip suspended solids that catalyze non-productive peroxide decomposition (S4). Landfill leachate sites have documented the same seasonal pattern (S4).
Preventing Future Failures: Jar Tests, Monitoring, and Sludge Economics
Reactive troubleshooting is expensive; the cheaper path is a quarterly jar-test protocol that includes a chloride and alkalinity challenge alongside the standard COD and color panels. Those two anions are the dominant drivers of peroxide over-consumption in the field, and a 30% over-stoichiometry penalty is not unusual once they spike together (S4). On the monitoring side, install continuous ORP and pH with 4–20 mA output to SCADA, and run a daily H2O2 residual grab at the reactor outlet. Trends matter more than single readings—a falling ORP plateau over a week is a scavenger problem before it becomes a discharge problem.
Budget Fenton sludge handling as the largest operating cost line, not chemicals. A 10 m³/h plant at 60 mg/L Fe²⁺ produces on the order of 20–30 tonnes DS/month that must be dewatered, and the press capacity, polymer dose, and cake disposal cost will exceed the peroxide invoice on most sites. For more on pump-side problems that show up when sludge handling is mis-sized, see this pump cavitation troubleshooting in wastewater guide. For AOP selection in adjacent industries such as adhesive manufacturing, the AOP system design for adhesive wastewater guide covers parallel design tradeoffs.
Frequently Asked Questions
What pH gives the highest Fenton COD removal?
Fenton COD removal peaks at pH 2.8–3.2, with the reaction rate falling sharply below 2.5 because [Fe(H2O)6]²⁺ dominates, and above ~4 because iron precipitates as Fe(OH)₃ and stops catalyzing peroxide decomposition (S5).
How much H₂O₂ should I dose relative to Fe²⁺?
Target an H2O2:Fe molar ratio between 100 and 1,000 for conventional Fenton, and 2–150 for photo-Fenton; ratios outside this range either waste peroxide or starve the catalytic cycle (S5).
Why is my Fenton sludge volume higher than design?
Sludge volume typically runs 1.5–2.5 kg dry solids per kg of Fe²⁺ dosed, so a 60 mg/L Fe²⁺ dose at 10 m³/h produces roughly 25–40 kg DS/h; overshooting the iron dose or neutralizing past pH 9 inflates that figure by 30% or more (S4).
What does a sluggish ORP curve after H₂O₂ dosing mean?
An ORP that fails to rise to the +400 to +600 mV band within