Ion Exchange System Troubleshooting: 2026 Engineering Guide
Ion exchange system troubleshooting is a five-step diagnostic workflow: verify operational errors, compare current performance against commissioning baseline (a 20% deviation in any key parameter triggers investigation), isolate the failure mode (output reduction, quality deterioration, or economic decline), map the symptom to a specific cation or anion problem using pH/conductivity/silica readings, then apply the cheapest fix first — regeneration, chemical cleaning, or mechanical inspection. Following this structure resolves roughly 20-30% of apparent faults without physical intervention.
Five Symptoms That Always Mean Your Ion Exchange System Needs Troubleshooting
Reduced throughput, poor product water quality, long rinse times after regeneration, increased pressure drop, and shortened resin life are the five operational signals that always warrant investigation. A 20% baseline-deviation rule applies uniformly: if any key parameter — cycle capacity, effluent conductivity, rinse volume, differential pressure, or resin age-to-capacity ratio — drifts more than 20% from the commissioning baseline recorded in the first three to six months of operation, the operator should treat it as a fault, not noise. Surface water sources can swing 15-30% seasonally in TDS, so the deviation check should run against a rolling baseline, not a single commissioning snapshot.
The five symptoms are interconnected in a predictable cascade. A fouled ion exchange resin typically shortens throughput first, then degrades product water quality, then lengthens rinse time as the bed's effective capacity collapses. Pressure drop rises later, once fouling has physically compacted the bed or blocked distributors. Operator-level fixes — regeneration adjustments, surfactant cleaning, regenerant dilution checks — usually resolve the first two stages of the cascade. Pressure drop and shortened resin life sit at the later stages and almost always need vendor support or a planned resin replacement.
The Three Failure Categories Every Troubleshooter Triage First
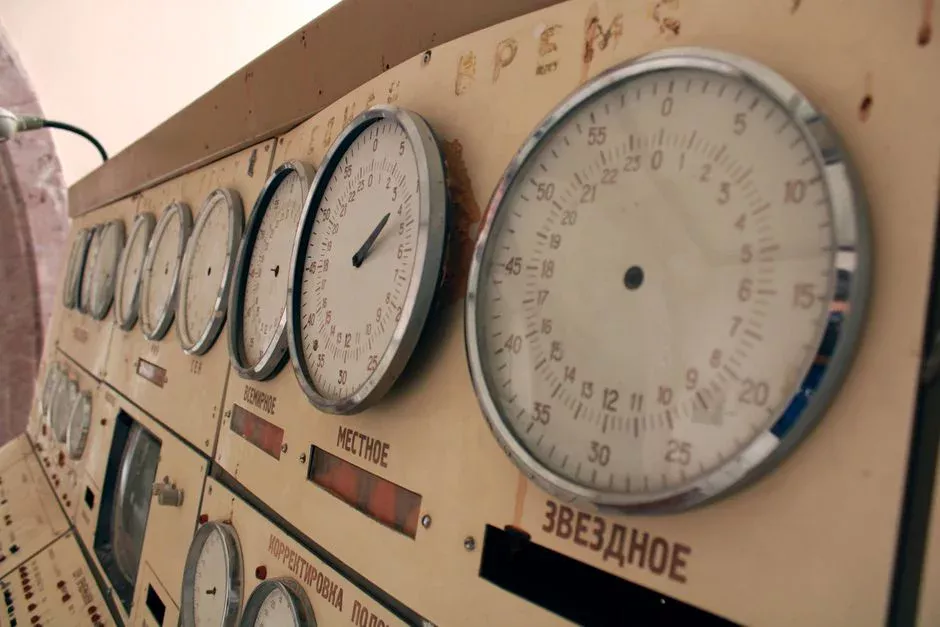
Reduced output, quality deterioration, and economic decline are the three categories every troubleshooter must classify before any further diagnostic work. Reduced output splits into cycle capacity (total ion removal per regeneration) and flow rate (water produced per unit time). Quality deterioration shows up as elevated conductivity, rising silica, or abnormal pH in the effluent. Economic decline is regenerant and self-water consumption drifting above baseline.
Surface-water systems can exhibit 15-30% seasonal capacity variation from raw-water load swings alone, so the operator must confirm a failure is stable across at least three consecutive operating cycles before treating it as equipment-related. A well-maintained commissioning report reduces diagnostic time by 40-60% by immediately ruling out seasonal and procedural noise.
| Failure Category | Primary Symptoms | Typical Cause Clusters | Diagnostic Priority |
|---|---|---|---|
| Reduced output | Lower cycle production; decreased flow rate | Resin fouling, flow distribution issues, resin loss | Check commissioning data first |
| Quality deterioration | High conductivity; elevated silica; abnormal pH | Resin exhaustion, regeneration failure, cross-contamination | Check effluent quality indicators |
| Economic decline | High regenerant consumption; increased self-water use | Aged resin, regenerant quality issues, distribution damage | Compare with original operating benchmarks |
Step 1: Exclude Operational and Analytical Errors Before Touching the Vessel
Excluding operational and analytical errors eliminates 20-30% of apparent equipment failures without any physical intervention. Sodium contamination from skin contact during sampling is documented to produce false cation-exhaustion readings; the fix is a clean-hands sampling protocol and duplicate measurement on a second calibrated instrument. Intermittent faults that appear and disappear without pattern are usually procedural — shift handover drift, a recently changed regenerant dilution ratio, or a miscalibrated control loop — and rarely indicate mechanical degradation. Stable faults that persist across at least three operating cycles are the threshold for treating the problem as equipment-related.
The cheapest sequence to run before any maintenance opening: review the last 10 regeneration logs for parameter changes, verify sampling technique against a written SOP, cross-check with duplicate measurements on a second instrument, and confirm the fault is stable rather than intermittent. Plant data from 2025-2026 operations shows this exclusion checklist resolves roughly one in four apparent faults without opening a manhole. Keep a written pre-troubleshooting checklist on the operator panel so the next shift runs the same exclusion sequence and the same fault gets the same answer.
Step 2: Compare Current Performance Against the Commissioning Baseline
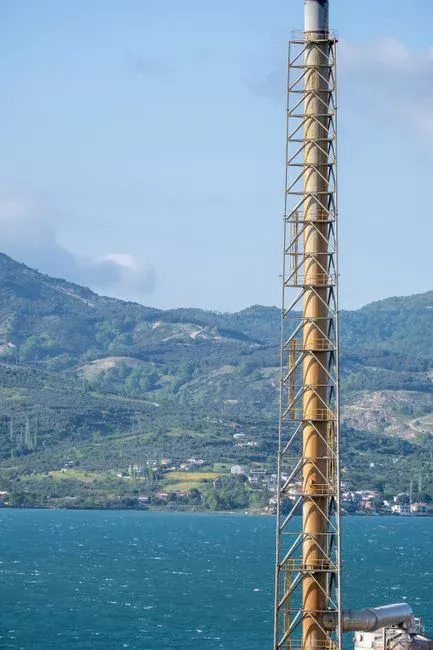
A well-maintained commissioning report reduces diagnostic time by 40-60% by immediately ruling out common causes and focusing the investigation on the most likely failure mechanisms. The baseline parameters that matter are water flow resistance (pressure drop at design flow), regenerant specific consumption (kg acid or caustic per cubic meter of resin per cycle), self-water consumption (m³ rinse per m³ product), regeneration conditions (concentration, flow, contact time), and working exchange capacity (kg CaCO₃ equivalent per m³ resin per cycle). Annual resin sampling and capacity testing is the evidence base for the next baseline update.
Track raw-water quality quarterly — surface and multi-source systems can swing 15-30% seasonally, and that swing mimics resin degradation if the comparison is only against the original commissioning values. A 20% deviation in any key parameter against the rolling baseline triggers investigation. The 20% rule functions as a trip wire, not a diagnosis: it tells the operator they have a real fault worth chasing, and the next steps localize it.
Step 3: Read the pH, Conductivity, and Silica Numbers to Localize the Fault
Three effluent measurements — conductivity, pH, and silica — localize the fault to a specific vessel or resin type in under five minutes. The principle behind the matrix is the equimolar stoichiometry of cation-anion exchange: at exhaustion, the cation effluent drifts acidic (H⁺ slip) and the anion effluent drifts alkaline (OH⁻ slip), and conductivity rises in both cases because unexchanged ions are passing through. Mixed-bed quality therefore moves in opposite pH directions depending on which resin exhausted first.
For series desalination systems — cation unit, anion unit, and mixed-bed polisher in sequence — the check runs vessel by vessel. Verify the cation unit effluent first (conductivity should be low, pH acidic due to strong-acid cation resin releasing H⁺). Then the anion unit (conductivity should be very low, pH near neutral to slightly alkaline). Then the mixed bed (silica should be below 0.02 mg/L as SiO₂ in a polished system). The first vessel in the sequence showing deviation localizes the fault.
| Effluent Observation | Likely Cause | Recommended Action |
|---|---|---|
| Conductivity high + pH acidic | Cation exchanger failure or cation resin exhaustion in mixed bed | Check cation unit effluent; regenerate or replace cation resin |
| Conductivity high + pH alkaline | Anion exchanger failure or anion resin exhaustion in mixed bed | Check anion unit effluent; regenerate or replace anion resin |
| Silica elevated, conductivity normal | Anion bed failure — silica breakthrough before ionic breakthrough | Check anion resin condition; increase regenerant dosage |
| Conductivity and silica both elevated | Mixed bed exhaustion or regeneration failure | Initiate off-line regeneration; inspect regeneration system |
The matrix localizes the vessel; it does not yet identify whether the cause is fouling, exhaustion, or regeneration error. That distinction is the next step.
Step 4: Diagnose Output Reduction — Cycle Capacity vs. Flow Rate

Output reduction splits into two sub-modes that require very different fixes. Cycle capacity reduction is total ion removal per regeneration declining over consecutive cycles — the resin is doing less work per unit of regenerant. Flow rate reduction is water produced per unit time dropping at a given feed pressure — something physical is blocking the bed.
For capacity reduction, rule out raw-water load change first (compare against the last 90 days of inlet TDS, not just the latest grab sample), then check resin aging or fouling. A gradual decrease in cycle production over 5-10 consecutive regenerations is the developing-fault indicator from plant operations data: it points to slow fouling or exhaustion rather than a single-event mechanical failure. For flow rate reduction, a pressure-drop increase of more than 50% over the commissioning baseline is the diagnostic threshold; usual causes are blocked distributors, compacted resin beds from oxidant damage, and debris accumulation in the underdrain. Pressure-drop measurement is the cheapest and fastest test available — read the inlet and outlet gauges before opening anything.
Output reduction typically precedes quality deterioration by several cycles. Early action on the capacity signal prevents the more disruptive consequences of an effluent quality excursion that triggers a downstream process alarm.
Step 5: Address Economic Decline — When Regenerant and Rinse Water Numbers Drift
When regenerant specific consumption exceeds baseline by more than 15%, the operator has an economic-decline fault even if the effluent quality is still on spec. The 15% threshold is the trip wire; the cause hunt runs cheapest-test first. Start with resin sample analysis for exchange capacity and fouling index, plus regenerant chemical assay for impurity content, before opening the vessel. Internal inspection is the most expensive step and should be the last resort.
| Possible Cause | Diagnostic Method | Solution |
|---|---|---|
| Resin aging or fouling reducing exchange capacity | Resin sample analysis for exchange capacity, fouling index | Chemical cleaning or resin replacement |
| Poor regenerant quality — high impurity ion content | Regenerant chemical analysis | Source better quality regenerant or increase dosage |
| Resin loss from backwash overflow or underdrain leaks | Measure resin bed height; check backwash flow rate | Replace lost resin; repair or replace underdrain system |
| Damaged regeneration distribution system | Visual inspection; flow pattern observation during regeneration | Repair or replace distributor nozzles/laterals |
| Operator error or regeneration system malfunction | Review regeneration logs; check control system operation | Retrain operators; calibrate or repair regeneration controls |
Resin foulants each have a targeted cleaning chemistry. Organics on anion resin respond to a brine squeeze at elevated temperature; oils require a carefully selected surfactant plus air-scour backwash (a wrong surfactant can foul the resin further); hardness scale on cation resin responds to acid or strong reducing agent; oxidant damage is preventable only — activated carbon, UV, or reducing-agent pretreatment. Source the appropriate water treatment parts, valves, and filter media for the specific cleaning protocol before applying any chemical that could degrade the resin.
Prevention Playbook: Pretreatment, Resin Selection, and Operating Discipline
Pretreatment is cheaper than the next unscheduled shutdown. For organic fouling on anion resin, the prevention stack is prechlorination plus clarification, activated carbon filtration, or a multistep IX arrangement using weak-base then strong-base anion resin. For oxidation damage, activated carbon, UV, or reducing-agent chemical dosing removes the oxidant before it contacts the resin. The resin manufacturer will have specific oxidant and temperature limits — some higher-crosslinked cation resins tolerate higher chlorine, but certain combinations of oxidant and resin can release ammonia or nitrogen gas, which is a confined-space hazard during regeneration.
Resin life sets the planning horizon for capex. Cation resins typically last 5-10 years; anion resins last 3-7 years due to greater susceptibility to organic fouling and thermal degradation. Channeling and resin loss are mechanical, not chemical, controls: correct flow rates, functional distributors, adequate backwash, and intact underdrain screens. A correctly specified industrial water softener system upstream of the demineralizer removes hardness that would otherwise consume cation capacity and foul the bed. Annual resin sampling and capacity testing tells the operator whether the planned replacement date is realistic or whether fouling is accelerating the schedule.
RO and UF pretreatment reduces the ionic and particulate load on the ion exchange stage and extends resin life significantly. Where feed water is variable or high in organics, an RO and UF membranes and filter elements train ahead of the IX train typically pays back in 18-30 months through reduced regenerant and longer resin life.
When to Call a Vendor: Escalation Triggers and What to Send the Engineer
Stop in-house troubleshooting and call a vendor when any of these triggers fires: pressure drop rises more than 50% over baseline, quality deviations persist after two regeneration cycles, regenerant consumption runs more than 15% over baseline for two consecutive months, or visible resin loss appears in the rinse water. Each of these signals a fault that operator-level intervention is unlikely to resolve, and continuing in-house work risks burning resin or voiding a warranty.
Send the vendor the following data set before the call: the last 10 regeneration logs with timestamps, commissioning baseline numbers for the specific unit, the latest resin sample analysis, a current raw-water analysis, and a photo of the pressure-drop trend charted against the baseline. Some interventions — acid cleaning of cation resin at elevated temperature, brine squeeze on anion resin, or any procedure involving unfamiliar chemicals — carry resin-degradation risk, so vendor sign-off is the safer path on first occurrence. For broader process context outside the ion exchange system, an experienced engineer reviewing the pump cavitation troubleshooting guide or the performance-based wastewater O&M contracts framework can also help frame the cost-of-failure conversation with plant management. Where the upstream biopharmaceutical wastewater profile is the source of organic loading, the activated carbon filter engineering guide covers the pretreatment options that prevent anion fouling at the source.
Frequently Asked Questions
How often should ion exchange resins be replaced?
Cation resins typically last 5-10 years; anion resins last 3-7 years because of greater susceptibility to organic fouling and thermal degradation. Annual resin sampling and working-exchange-capacity testing tells the operator whether replacement is needed, rather than running on a fixed schedule. If working capacity drops more than 20% from the commissioning baseline, replacement is due.
What causes high regenerant consumption in ion exchangers?
High regenerant consumption is most commonly caused by resin fouling or aging reducing exchange capacity, poor regenerant quality with high impurity content, damaged distribution systems causing uneven flow, or resin loss from backwash overflow. A regenerant specific consumption more than 15% over baseline for two consecutive months triggers a cause hunt, starting with resin sample analysis and regenerant assay before any internal inspection.
How can I tell if the cation or anion resin has failed?
In a mixed bed, conductivity rising with pH staying acidic means cation resin has failed; conductivity rising with pH alkaline means anion resin has failed. In series systems, check effluent conductivity and silica after each vessel — a normal reading after the cation unit followed by abnormal readings after the anion unit points to anion resin failure. Silica breakthrough before ionic conductivity breakthrough is a signature of weak-base anion exhaustion.
What is the most common cause of ion exchanger flow rate reduction?
The most common cause is excessive flow resistance from a blocked or skewed resin bed, usually from debris accumulation in the inlet distribution system or underdrain. A pressure-drop increase of more than 50% above the commissioning baseline is the diagnostic threshold and usually requires internal inspection through the manhole. Oxidant-induced bed compaction produces the same signature over a longer time scale.
Can raw water quality changes mimic ion exchanger failure?
Yes. Rising inlet TDS reduces the volume of treated water per regeneration cycle, appearing as reduced capacity, and seasonal organic content changes in surface water accelerate anion fouling, mimicking degradation. Surface-water systems can swing 15-30% seasonally, so always compare current raw water quality with the commissioning baseline before concluding resin failure. The 20% baseline-deviation rule applies against a rolling baseline, not a single commissioning snapshot.