Why Agricultural-Chemicals Wastewater in Willows Is a Different Problem
Willows, the Glenn County seat, anchors the Sacramento Valley's onion, rice and walnut economy, and hosts the formulation and packaging plants that ship crop-protection products to growers across California. Typical effluent flows at those facilities run 50–800 m³/day, with peak irrigation-season loads pushing the upper bound. The chemistry is unlike anything a municipal plant sees: COD 800–2,500 mg/L, BOD5 200–600 mg/L, TSS 150–500 mg/L, and salinity 1,500–4,000 mg/L from irrigation return and process washwater. On top of that matrix sit recalcitrant actives — atrazine, glyphosate, chlorpyrifos, 2,4-D and MCPA — at 1–50 mg/L each, plus the surfactants and solvents that keep them in suspension.
Three regulators set the ceiling. The Central Valley Regional Water Board's Basin Plan controls surface-water discharge limits for BOD5, TSS, nutrients and priority pollutants. CV-SALTS imposes salinity benchmarks that a 1,500–4,000 mg/L influent cannot meet without brine management. California Title 22 dictates reuse criteria whenever a facility irrigates its own buffer ground or discharges to a lined pond that recharges crops. Conventional activated sludge (CAS) struggles against this combination: surfactant shock triggers bulking, pesticide toxicity knocks nitrifiers offline, and the 5–15 day SRT typical of CAS simply does not give slow-growing degraders enough contact time to mineralize chlorpyrifos or atrazine — which is why MBR vs conventional activated sludge for Agricultural Chemicals wastewater in Willows, United States, is a genuinely different question than the same comparison at a sewage plant.
How an MBR Works on Pesticide-Loaded Influent
An MBR is an activated-sludge basin coupled to a submerged ultrafiltration membrane, typically 0.03–0.1 μm pore, that replaces the secondary clarifier entirely. The biomass stays in the reactor, the membrane physically rejects solids and most high-molecular-weight organics, and the clarified permeate leaves the tank. The DF series flat-sheet PVDF membrane module used in standard packaged systems delivers 0.1 μm nominal cutoff with 80–225 m² of active area per cassette and a per-module throughput of 32–135 m³/day — the right envelope for a 50–800 m³/day agrochemical plant.
The first mechanism that matters for pesticide removal is sludge retention time. MBR systems commonly run 20–60 day SRT versus 5–15 days in CAS, which directly addresses the recalcitrance of atrazine, chlorpyrifos and neonicotinoids by giving slow-growing degraders the residence time they need (Mannina et al., S3). The second mechanism is the physical barrier. With a 0.1 μm PVDF flat-sheet membrane, particulates, microplastic carriers and most bound pesticide residues stay in the reactor, where they continue to be metabolized. The third is biomass concentration — MBRs run 8,000–12,000 mg/L MLSS versus 2,000–4,000 mg/L in CAS, so the system digests shock loads without washout. Effluent polish is correspondingly tight: TSS <1 mg/L, BOD5 <5 mg/L, NH4-N <1 mg/L out of the membrane tank, with no tertiary filter required (S2, cross-referenced). The trade-off is membrane fouling: chemical CIP every 6–12 months and continuous air-scour aeration add 0.2–0.4 kWh/m³ to the energy bill versus CAS. For a packaged turnkey build, an integrated MBR wastewater treatment system sized 10–2,000 m³/day covers the Willows plant-size range directly.
How Conventional Activated Sludge Handles the Same Stream
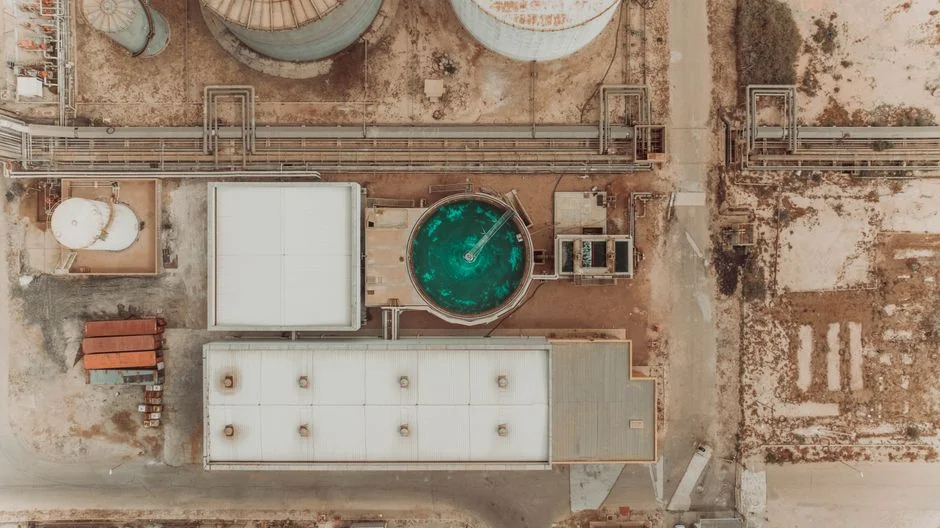
Standard CAS trains in Glenn County follow the municipal template: screening, grit removal, equalization, an aeration basin held at MLSS 2,000–4,000 mg/L, a secondary clarifier, and chlorination. The benchmark from S2 is informative even though it is municipal: an extended-aeration activated sludge plant (EA-ASP) running on domestic sewage at Al-Bukayriyah delivered BOD5 5 mg/L, COD 18.5 mg/L, TSS 2.1 mg/L and NH4-N 0.1 mg/L. The same configuration on agrochemical waste runs 2–5× higher in effluent COD and TSS because the influent matrix is 5–10× stronger and contains recalcitrant fractions that do not fully oxidize in 5–15 day SRT.
Three recurring problems show up in Willows-area CAS operations. Bulking from surfactant shock is the first — non-ionic and anionic surfactant packages in pesticide formulations favor filamentous growth, and bulking episodes routinely push sludge volume index (SVI) above 250 mL/g. Nitrification crashes from pesticide toxicity are the second: a 2–5 mg/L pulse of chlorpyrifos or atrazine into the aeration basin can knock ammonia removal off-line for 7–14 days, which is exactly the window a Regional Board inspector is most likely to be on-site. Third, clarifier solids washout during harvest-season flow peaks — the same period when produce is being treated and packaged — pushes TSS past permit limits for 24–72 hours at a stretch. The genuine advantage of CAS, the reason it still gets specified, is the lowest CAPEX and the deepest local operator pool. If your plant has a permitted aeration basin already in the ground and your discharge goes to a lined evaporation pond, the secondary clarifier working principle guide covers the upgrade path that keeps the existing civil works intact.
MBR vs CAS Side-by-Side: The 2026 Numbers
The table below is the one to screenshot. Numbers draw from S2 (EA-ASP benchmark), S3 (Mannina et al. plant-wide model), and Lares et al. 2018 as cited in S3. Energy and GHG figures are normalized to 1 m³ of treated agrochemical-strength influent at a 200 m³/day facility operating in California's grid mix.
| Parameter | CAS (conventional activated sludge) | MBR (membrane bioreactor) |
|---|---|---|
| Effluent TSS | 2–10 mg/L (clarifier-limited) | <1 mg/L (membrane-rejected) |
| Effluent BOD5 | 5–15 mg/L | <5 mg/L |
| SRT | 5–15 days | 20–60 days |
| Footprint (relative) | 1.0× baseline | 0.4–0.5× baseline |
| Energy demand | 0.5–0.7 kWh/m³ | 0.7–1.1 kWh/m³ |
| Direct GHG | 0.85 kgCO2eq/m³ | 0.91 kgCO2eq/m³ |
| Microplastic carrier removal | ~1 MP/L in effluent (Lares et al. 2018) | ~0.4 MP/L in effluent (Lares et al. 2018) |
Two longer-horizon points matter for capital planning. Karim and Mark 2017 (via S3) found that MBR's higher first-cost is amortized when operating life exceeds 67 years — clearly a theoretical limit, but useful as a defensible number when a finance team pushes back on CAPEX. And the microplastic differential is not just an academic footnote: pesticide formulations increasingly use polymer carriers, and the 60% lower MP loading in MBR permeate is the difference between passing and failing an effluent toxicity test in some California watersheds.
Matching the Technology to Your Willows Discharge Pathway
The actual decision in the Sacramento Valley is not "MBR versus CAS" in the abstract — it is which technology gets you down each of the three permitted discharge pathways without a retrofit. Path A is surface-water discharge under a Central Valley Regional Water Board permit, where salinity, BOD5 and TSS are the binding constraints. If you can meet those with a well-run CAS basin and your lined pond is in compliance, CAS is usually sufficient and cheaper. Path B is on-site irrigation reuse under California Title 22, which requires tertiary-filtered reuse criteria of <2 NTU turbidity and <1 mg/L TSS — levels MBR hits directly out of the membrane tank, but which force CAS operators to add a denitrification filter, a sand filter or a cloth-media step. Path C is zero-liquid-discharge to an evaporation pond or to a downstream RO concentrator, where MBR's low TSS and SDI <3 permeate is the better feed conditioner, lowering RO fouling rate and CIP frequency per the Spanish MBR-in-ZLD data set cross-referenced in our MBR module page.
A Willows-specific constraint shapes all three paths: many sites sit on porous Tehama formation soils, so the Regional Board often requires lined ponds and reuse-grade treatment before any surface or subsurface discharge is allowed. That is why the DF series flat-sheet PVDF membrane module typically appears in Willows specifications regardless of which final pathway is chosen — the membrane gives operators a permit-defensible buffer if the discharge pathway is later reclassified. For a side-by-side view from a different industry, see the parallel MBR vs CAS for mining wastewater in Coatesville comparison.
2026 CAPEX and OPEX Bands for a Willows Agrochemical Plant
The 2026 dollar bands below are sized for a Willows-area agrochemical plant in the 10–2,000 m³/day envelope, in USD, excluding land and influent pumping. They reflect industry-typical turnkey installed costs as of 2026 and should be treated as planning figures, not bids.
| Cost element | CAS upgrade of existing basin | New MBR system (PVDF) |
|---|---|---|
| CAPEX (installed) | $200–$500 per m³/day capacity | $800–$1,800 per m³/day capacity |
| Membrane cost add-on | N/A | $120–$250 per m² PVDF flat-sheet |
| OPEX (operating, 2026) | $0.25–$0.55 per m³ treated | $0.55–$1.10 per m³ treated (incl. 7–10 yr membrane replacement amortization) |
| Energy surcharge vs CAS | Baseline | +0.2–0.4 kWh/m³ ≈ $0.02–$0.05/m³ at California commercial rates |
The integrated MBR wastewater treatment system covers the 10–2,000 m³/day envelope that represents roughly 90% of Willows-area plant sizes, which removes a lot of custom-engineering cost from the budget conversation. Plants that already dose coagulant, antiscalant or pH adjustment should also budget an automatic chemical dosing system tied into the MBR control panel to keep membrane fouling indices inside the manufacturer's warranty band. The mining-sector comparison (MBR vs CAS in Coatesville, PA) and the fabricated-metals comparison (MBR vs CAS in Erie) confirm that the same CAPEX/OPEX ratio holds in other heavy-industry contexts, so the Willows estimate is not an outlier.
Decision Framework: When to Choose MBR, When CAS Still Wins
Five rules of thumb will get a Willows plant engineer to the right answer in under an hour:
- Need Title 22 reuse-quality effluent for on-site irrigation or for a regional board reuse permit → choose MBR. CAS will not hit <2 NTU without added tertiary filtration.
- Site footprint <0.5 ha and design flow >100 m³/day → choose MBR. MBR's 50–60% smaller footprint (S5) is the only way the unit operations fit.
- Influent contains known recalcitrant actives (atrazine, chlorpyrifos, neonicotinoids) and discharge limits are <0.1 mg/L for the parent compound → choose MBR. The 20–60 day SRT window is what gets you below the limit.
- Brownfield CAS basin already permitted, capital is constrained, and discharge goes to a lined evaporation pond → upgrade CAS first, plan MBR in phase 2 once reuse pathways open up.
- Highly variable seasonal flows with a 5× swing between formulation and packaging campaigns → choose MBR. MBR's tolerance to load variation (S5) keeps effluent stable when CAS would be washing out.
The cleanest 2026 decision rule: when the binding constraint is pollutant destruction (recalcitrant pesticides), discharge quality (Title 22 reuse), or footprint, MBR wins despite the energy and CAPEX premium. When the binding constraint is first-cost and a lined pond already takes the discharge, CAS still does the job.
Frequently Asked Questions
What effluent can an MBR realistically achieve on pesticide-loaded agrochemical wastewater in Willows?
An MBR running 20–60 day SRT with submerged 0.1 μm PVDF membranes routinely delivers TSS <1 mg/L, BOD5 <5 mg/L and NH4-N <1 mg/L out of the membrane tank, which meets California Title 22 reuse criteria without a separate tertiary filter (per S2 and the integrated MBR wastewater treatment system spec).
How long does it take to amortize MBR's higher CAPEX over a CAS retrofit?
Karim and Mark 2017 (cited in S3) show the MBR CAPEX premium is amortized over very long operating life — on the order of 67 years in their model — but the more practical 2026 metric is that OPEX parity is reached within 4–7 years once Title 22 reuse revenue, brine-haul savings and reduced sludge disposal are credited against the higher membrane OPEX.
Which pesticide actives are hardest on a CAS biomass in Glenn County?
Field experience and published biodegradation kinetics point to chlorpyrifos and the neonicotinoids (imidacloprid, clothianidin) as the most toxic to nitrifiers at 1–5 mg/L pulses, with atrazine a close third because of its long half-life relative to typical 5–15 day CAS SRT. All three are degraded more completely at the 20–60 day SRT an MBR maintains, per the DF series membrane module operating envelope.
Does MBR increase direct greenhouse-gas emissions compared with CAS?
Slightly — Mannina et al. (S3) report 0.91 kgCO2eq/m³ for MBR versus 0.85 kgCO2eq/m³ for CAS, a 7% increase driven mainly by the air-scour blowers. The penalty is usually offset by avoided sludge hauling, avoided tertiary filtration, and the credit for Title 22 reuse water that displaces fresh groundwater pumping.