Why Petroleum Bulk Wastewater Breaks a Conventional Activated Sludge Plant
A settled CAS basin washing out during a January cold snap — when influent viscosity spikes and free oil passes through the API separator — is the most common failure mode at San Jose petroleum bulk terminals. The influent is not the 250 mg/L COD, 35 °C, steady municipal feed that the textbook MBR-vs-CAS literature is built on. For terminal storage tank draws, hydrotest water, ballast, and refinery process condensate, expect 200–2,000 mg/L COD, 50–500 mg/L oil and grease, and intermittent benzene/toluene spikes (HydropureWater field data, 2026). Free and emulsified oil coats the activated-sludge floc, raises the Sludge Volume Index (SVI) past 200 mL/g, and the blanket in the secondary clarifier drifts over the weir at 4 a.m. on a Sunday.
This is exactly why the petroleum-refinery MBR data point in the research exists at all. Aerobic MBR with submerged PVDF 0.04 µm MF delivered TOC 12.70 mg/L, NH4-N 1.6 mg/L, and NO3-N 169 mg/L on refinery feed (Frontiers 2024, Table 1) — researchers had to bypass the clarifier because conventional settling was unreliable on this influent. The 0.04–0.1 µm membrane physically retains biomass regardless of floc settleability, decoupling SRT from hydraulic conditions — the single biggest mechanistic difference for an oil-laden feed. Local compliance is layered on top of the chemistry: petroleum-handling facilities in Region 2 are subject to narrative and numeric effluent and Basin Plan limits (San Francisco Bay RWQCB Basin Plan, current), the City of San Jose Industrial Wastewater Pretreatment Program applies local limits on oil & grease and sulfide, and the Bay Area Pollution Prevention Group (BAPO) Best Management Practices set inspection and housekeeping expectations. A DAF oil-removal pre-treatment step in front of either biology train keeps free oil below 25 mg/L and protects downstream MLVSS from chronic washout.
How MBR and CAS Differ Inside the Tank
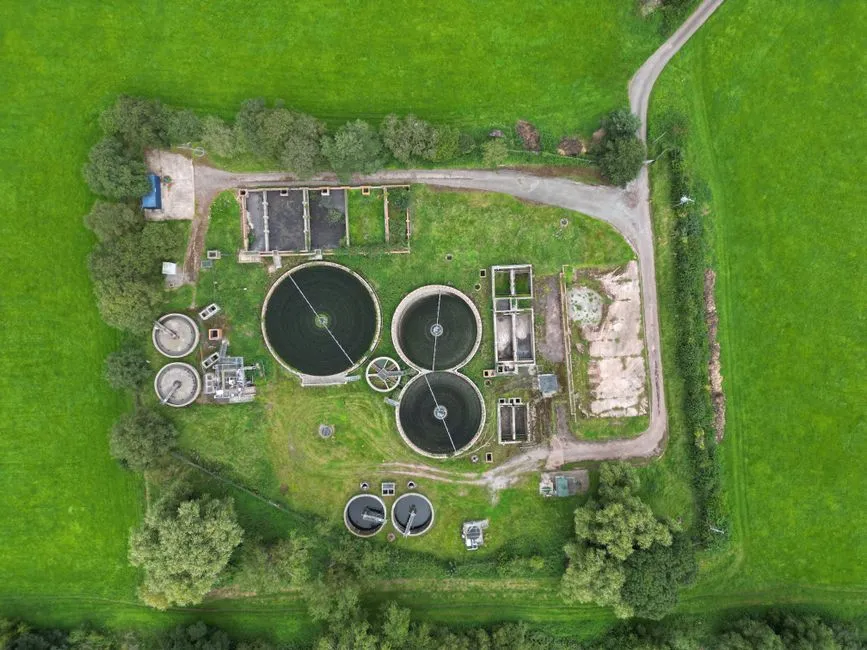
A membrane bioreactor is an activated sludge reactor in which solid–liquid separation is performed by a permselective membrane rather than a gravity clarifier (Judd 2010, restated in PMC7762199). That single substitution changes every downstream design number. In a CAS train, the secondary clarifier is the weak link: HRT is locked to SRT through the sludge recycle line, MLSS sits at 1,500–3,500 mg/L because higher concentrations settle poorly, and the operator's main lever is wasting rate. In an MBR, the membrane retains all biomass in the aeration basin, so HRT is 2–6 h while SRT runs 20–60+ days, decoupled from each other. Volumetric reaction rates are roughly twice CAS, which is the reason MBRs land on a 40–60% smaller pad (HydropureWater product data, 2026; PMC7762199).
The operating numbers track the biology. F/M for an MBR sits near 0.1 kg COD/(kg MLVSS·d), MLSS runs 8,000–12,000 mg/L, and the MLVSS/MLSS ratio is typically ~0.50 at low F/M versus ~0.73 in a CAS basin at the same plant. Excess sludge drops to <0.1 kg MLVSS/kg COD at low loading, so the dewatering line sees roughly half the mass of a CAS train at equivalent influent load. A full-scale A2O-MBR has demonstrated 90.0% COD, 98.2% NH4-N, and 96.2% TP removal (PMC7762199) — numbers a CAS basin only hits on a warm, dry, low-oil day.
The membrane costs energy. Coarse-bubble scouring, periodic backwash, and clean-in-place (CIP) push MBR energy demand to 0.5–0.7 kWh/m³ for a well-designed submerged module, and 2.0–12.0 kWh/m³ for a high-shear or external-loop system (PMC7762199). For a San Jose petroleum train with DAF pre-treatment and a 0.1 µm flat-sheet module, the realistic range is 0.6–1.2 kWh/m³ — within the lower end of the published band, and the band an engineer should quote when finance asks for a power-draw number.
Side-by-Side Parameters for San Jose Petroleum Service
| Parameter | CAS (settling) | MBR (submerged PVDF) | Hybrid MBBR + clarifier |
|---|---|---|---|
| Footprint (m² per m³/d) | ~0.10–0.15 | ~0.04–0.06 | ~0.07–0.10 |
| MLSS (mg/L) | 1,500–3,500 | 8,000–12,000 | 2,000–4,000 (attached + suspended) |
| SRT (days) | 5–20 | 20–60+ | 10–25 |
| F/M (kg COD/kg MLVSS·d) | 0.2–0.5 | ~0.1 | 0.2–0.4 |
| Effluent COD (mg/L) | 40–80 (excursions to 150 during oil spikes) | <50 (typically 20–40) | 60–100 |
| Effluent TSS (mg/L) | 10–30 (excursions to >50) | <5 | 15–30 |
| Effluent NH4-N (mg/L) | 2–8 (cold weather 10–15) | ~1.6 (Frontiers 2024 refinery) | 3–10 |
| Energy (kWh/m³) | 0.3–0.6 | 0.6–1.2 (submerged flat-sheet) | 0.4–0.7 |
| Sludge yield (kg MLVSS/kg COD) | 0.3–0.5 | <0.1 at low F/M | 0.2–0.4 |
Figures represent typical ranges from PMC7762199 and the Frontiers 2024 review; site-specific pilot testing is required for any San Jose permitting pathway, especially where the influent temperature drops below 15 °C in winter and free-oil carryover from the API separator exceeds 100 mg/L.
Effluent Quality on Real Refinery Feed
Only one row in the available MBR literature is labeled "petroleum refinery wastewater" rather than municipal, antibiotic, or dairy — and that is the row that should anchor the San Jose case. An aerobic MBR with submerged PVDF hollow-fibre MF at 0.04 µm produced TOC 12.70 mg/L, NH4-N 1.6 mg/L, and NO3-N 169 mg/L directly from refinery feed (Frontiers 2024, Table 1). For a San Jose POTW discharge, TOC of 12.70 mg/L and NH4-N of 1.6 mg/L sit comfortably inside any reasonable local limit; the elevated NO3-N is a flag for downstream treatment if the operator is planning reuse, because nitrogen — not carbon — becomes the design constraint once carbon oxidation is essentially complete.
The contrast with CAS is the absence of the clarifier failure mode. Reported CAS refinery performance rides the weather: TSS excursions during oil spikes drive periodic permit excursions, and the operator manages risk by over-building equalization and adding polymer to the clarifier — both temporary fixes. The MBR's physical barrier replaces the gravity settler with a deterministic 0.04 µm cutoff, so the effluent TSS does not move with the SVI. For oil-laden refinery feed, 0.04 µm MF is the conservative pore-size choice; for cleaner industrial streams, 0.1 µm is acceptable, and the HydropureWater DF series flat-sheet MBR membrane module ships at 0.1 µm with an integrated aeration box for continuous scouring — a configuration that drops membrane area per m³/d roughly 20% versus externally manifolded cassettes. The Frontiers review also documents the standard MBR + NF/RO polishing train: MBR permeate goes to RO at 40–50% recovery, and the combined system drives TOC to <1 mg/L — the only realistic feed for on-site reuse of hydrotest or cooling-tower make-up water.
Bay Area Compliance, Permitting, and Site Constraints
A San Jose petroleum project stacks three permits before a single cubic meter can be discharged. At the top: San Francisco Bay RWQCB (Region 2) waste discharge requirements, which adopt narrative and numeric limits from the Basin Plan for petroleum-handling facilities. In the middle: the City of San Jose Industrial Wastewater Pretreatment Program, which sets local discharge limits for TSS, oil & grease, sulfides, and benzene. At the bottom: BAPO Best Management Practices, which cover inspection, secondary containment, and stormwater at the bulk-plant pad. The combined practical targets the system must hold continuously: TSS ≤30 mg/L, oil & grease ≤10–15 mg/L, and COD/BOD consistent with the receiving POTW's local limits.
MBR holds these continuously because the membrane's physical cutoff is independent of floc settleability. CAS rides weather and feed quality — the same influent that produces TSS of 12 mg/L on a Tuesday can produce 80 mg/L on a Saturday after a hydrotest discharge. Region 2 is unlikely to accept a permit application that relies on operational discipline alone to hold a 30 mg/L TSS limit, and an MBR's monitoring record is the simplest defense at a public hearing. Site constraints reinforce the choice: many South Bay terminals sit on small pads near residential or mixed-use zoning, sit on seismic class D or worse soils, and overlie the Santa Clara Valley groundwater basin. A closed-tank MBR with DAF pre-treatment fits where a clarifier and equalization lagoon do not, and the closed envelope controls VOC emissions to a level Region 2 will accept without an ambient air permit amendment. If the operator is exploring on-site reuse for hydrotesting or cooling-tower make-up, MBR permeate is the only realistic feed to RO polishing for reuse — and the cost crossover argument shifts in favor of MBR the moment reuse enters the business case.
Cost, Energy, and 5-Year Total Cost of Ownership
Headline number first: in the only plant-wide modelling comparison that ran CAS and MBR on the same influent and same boundary conditions, MBR's total cost overtakes CAS only beyond ~67 years of operation (Karim & Mark 2017, restated in Mannina 2019). On a 5-year horizon, MBR is almost never justified on OPEX alone — the energy penalty and membrane replacement beat CAS on $/m³ in almost every scenario where the site is not reuse-driven. Quantify the penalty honestly: MBR uses 0.5–12.0 kWh/m³ depending on configuration (PMC7762199), versus ~0.3–0.6 kWh/m³ for a conventional CAS train; for a 500 m³/d South Bay plant at PG&E's 2026 industrial schedule, that is roughly $35,000–$70,000 per year of additional power at the upper end.
The offset is real but does not close the gap. MBR excess sludge production is <0.1 kg MLVSS/kg COD at F/M of about 0.1 (PMC7762199), versus 0.3–0.5 kg MLVSS/kg COD for CAS — roughly half the mass to haul and dewater. For a 500 m³/d plant at 1,000 mg/L COD, that is ~150 dry tonnes/year less cake, or about $30,000–$45,000/year in avoided hauling and dewatering polymer, plus a plate-and-frame filter press for sludge dewatering sized smaller by the same factor. The TCO case for MBR on a 5-year horizon builds from three sources that are easy to defend to finance: avoided clarifier retrofits (CAS clarifiers in petroleum service typically need rebuild at year 7–10 due to oil-induced corrosion of launders and weirs), smaller pad → lower land cost or avoided leased-space cost in the South Bay, and avoided effluent-excursion penalties under the local POTW permit — one TSS excursion at 80 mg/L against a 30 mg/L limit can trigger a Notice of Violation and a pretreatment fine that exceeds a year's membrane-replacement budget. On a triple-bottom-line basis, MBR's direct GHG emissions sit at 0.91 kgCO2eq/m³ versus 0.85 kgCO2eq/m³ for CAS in the benchmark scenario (Mannina 2019, Fig. 2) — a 7% penalty that reverses when the project adds an AnMBR train, where 80–90% CH4 in the biogas offsets the energy import.
Decision Framework: When to Pick MBR vs CAS for a San Jose Petroleum Site
Pick MBR when any one of the following applies: the available pad is <60% of the CAS footprint; free-oil spikes are routine and the existing API/DAF train cannot guarantee <25 mg/L free oil to the bioreactor continuously; on-site reuse of hydrotest or cooling-tower make-up water is on the 5-year roadmap; the project must hold BAPO-tier performance (TSS ≤30 mg/L, O&G ≤10–15 mg/L) consistently across winter cold snaps; or the receiving POTW has indicated through a compliance letter that conventional clarifier performance is no longer acceptable. Pick CAS when the site is a brownfield with working secondary clarifiers, OPEX dominates the business case, sludge yield is not a hauling-cost constraint, and no reuse is on the 5-year roadmap. Pick MBBR or SBR as a middle path when capital is tight but floc washout is a known issue — the SBR troubleshooting guide covers the operating envelope for that hybrid case. For any CAPEX commitment above $250,000, run a 90-day on-site pilot with parallel trailer-mounted MBR and CAS trains at 1–5 m³/d each, and align the influent/effluent sampling schedule to the POTW's self-monitoring report so the data is usable in the permit application.
Frequently Asked Questions
What is an MBR and what pore size does it use for petroleum wastewater?
A membrane bioreactor (MBR) is an activated sludge reactor in which solid–liquid separation is performed by a submerged PVDF ultrafiltration or microfiltration membrane (0.04–0.1 µm) instead of a gravity clarifier; the 0.04 µm pore size is the conservative choice for oil-laden refinery feed.
What effluent quality can a submerged PVDF MBR deliver on refinery feed?
The petroleum-refinery row in the recent hybrid MBR review reports TOC 12.70 mg/L, NH4-N 1.6 mg/L, and NO3-N 169 mg/L from a submerged PVDF 0.04 µm MF module (Frontiers 2024, Table 1); a full-scale A2O-MBR has demonstrated 90.0% COD removal, 98.2% NH4-N removal, and 96.2% TP removal (PMC7762199).
How much smaller is an MBR than a CAS plant, and what is the energy penalty?
An MBR delivers roughly 60% footprint reduction versus a CAS plant of equivalent capacity (HydropureWater product data, 2026; PMC7762199), and submerged flat-sheet modules use a fraction of the energy of external cross-flow systems; the published MBR energy range is 0.5–12.0 kWh/m³ (PMC7762199), with a realistic 0.6–1.2 kWh/m³ for a well-designed submerged flat-sheet train with DAF pre-treatment.
How do MBR and CAS compare on greenhouse-gas emissions and biogas potential?
In the plant-wide benchmark scenario, direct GHG emissions are 0.85 kgCO2eq/m³ for CAS versus 0.91 kgCO2eq/m³ for MBR (Mannina 2019); an anaerobic MBR (AnMBR) reverses this because the biogas contains 80–90% CH4 and the recovered energy offsets the membrane electrical demand (PMC7762199).
Which permits control a petroleum bulk wastewater discharge in San Jose?
A San Jose petroleum project must satisfy the San Francisco Bay RWQCB (Region 2) waste discharge requirements and Basin Plan narrative/numeric limits, the City of San Jose Industrial Wastewater Pretreatment Program local limits, and the BAPO Best Management Practices for petroleum bulk plants.
Related Equipment
- integrated MBR membrane bioreactor system — specifications, capacity range, and technical data
- DAF oil-removal pre-treatment — specifications, capacity range, and technical data