Why Semiconductor Wastewater in Saint Petersburg Forces a Biological-Stage Decision
A typical Saint Petersburg, FL semiconductor fab discharges a wastewater matrix that conventional activated sludge (CAS) and membrane bioreactor (MBR) comparisons built on textile or municipal data never anticipated. UPW reject carries low BOD/COD ratios in the 0.1–0.3 range; CMP slurry contributes 200–2,000 mg/L of abrasive silica or ceria; HF-bearing etch rinse delivers 20–200 mg/L fluoride; TMAH developer arrives in periodic slugs of 50–500 mg/L; NMP/SU-8 stripper pushes solvent loads to several hundred mg/L; IPA rinses add another 50–150 mg/L of volatile organics; SCREEN-OH cleaning cycles spike ammonia-nitrogen to 100–300 mg/L in a single shift; and glycol heat-exchanger bleed sustains a chronic COD baseline of 300–800 mg/L (per typical 300 mm fab mass balance, 2025-08). The biological stage must absorb that combination, not a single surrogate stream.
The regulatory stack compounds the problem. Any fab discharging to the Pinellas County POTW must satisfy EPA 40 CFR 403 General Pretreatment Standards and the City of St. Petersburg Sewer Use Ordinance, both of which set numeric limits on pH (5.5–10.5), fluoride (≤50 mg/L typical local limit), ammonia (varies by industrial user permit), and heavy metals. Fabs operating their own industrial wastewater plant and discharging to surface water fall under an FDEP Industrial Wastewater Permit, which is typically stricter than the POTW route and adds chronic toxicity testing. Florida's water-reuse emphasis under Chapter 62-610 F.A.C. and the high water table in Pinellas County push most fabs toward RO polishing of biological effluent for reuse, which means the biological stage's TSS and turbidity output directly determines RO membrane life. The decision the engineer is making is not "MBR or CAS" as a textbook exercise — it is which solids-separation step keeps the fab inside both the FDEP and Pinellas POTW envelope while protecting downstream RO.
Process Fundamentals: How MBR and CAS Treat the Same Fab Stream Differently
Conventional activated sludge is suspended-growth biological oxidation — an aeration basin where heterotrophic and nitrifying bacteria consume COD and ammonia — followed by a gravity secondary clarifier that settles the mixed liquor. Settleability of the MLSS controls effluent quality: a healthy sludge volume index (SVI) of 80–150 mL/g keeps the clarifier blanket stable; bulking sludge (SVI >200 mL/g) sends solids over the weir and into the discharge.
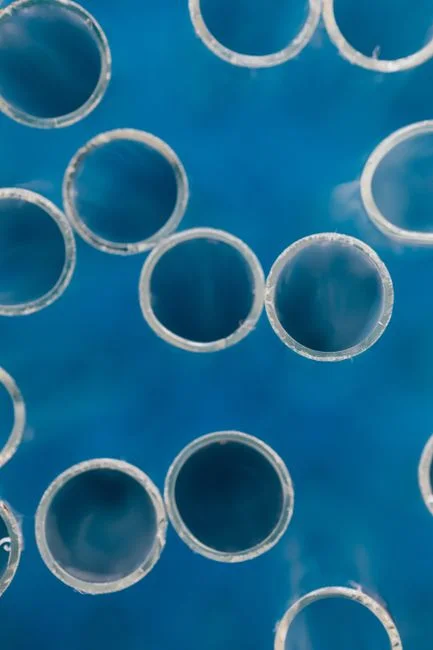
A membrane bioreactor substitutes the clarifier with submerged MF or UF membranes, typically 0.03–0.4 µm pore size per the standard MBR process description, mounted in hollow-fiber or flat-sheet modules directly in the aeration tank or in a separate membrane tank. Permeate is pulled through the membrane wall under a slight vacuum (typically 0.1–0.5 bar TMP); biomass and most suspended solids are physically retained and returned to the bioreactor. The mechanical separation decouples SRT from HRT, so designers can hold a 30–60 day SRT in a 6–10 hour HRT basin. Long SRT is what lets an MBR maintain a nitrifier population large enough to ride out an SCREEN-OH ammonia spike that would push a CAS clarifier past its ammonia limit within a single shift.
The same mechanism that protects nitrifiers also makes the MBR footprint smaller. MBR basins run 8,000–12,000 mg/L MLSS versus 2,000–4,000 mg/L in CAS, which compresses the required aeration volume by roughly the same factor. HydropureWater DF-series flat-sheet modules use 0.1 µm PVDF with an integrated aeration box that continuously scours the membrane surface, which is the practical way to keep transmembrane pressure stable at the high MLSS densities a fab stream demands. The trade-off is that every membrane-protected benefit depends on a disciplined upstream pretreatment train — without it, the MBR's mechanical separation becomes a fouling liability rather than an asset.
MBR vs CAS Parameter Comparison for Semiconductor Wastewater
The table below consolidates typical design and operating parameters for both technologies against fab wastewater. The COD removal values are drawn from comparative pilot data (89–92% MBR vs 54–70% CAS, per a 244-day textile pilot study, 2024) and are presented here as a process-comparable baseline; fab-specific performance on a real TMAH/NMP/HF stream is site-specific and must be confirmed by on-site piloting, not extrapolated from textile or municipal studies.
| Parameter | CAS (Conventional Activated Sludge) | MBR (Membrane Bioreactor) |
|---|---|---|
| MLSS range | 2,000–4,000 mg/L | 8,000–12,000 mg/L |
| SRT (typical) | 5–15 days | 30–60 days (decoupled from HRT) |
| HRT (typical) | 6–12 h | 6–10 h |
| Separation mechanism | Gravity clarifier (settleability-dependent) | Submerged MF/UF membrane, 0.03–0.4 µm (0.1 µm for DF-series PVDF flat-sheet) |
| Effluent turbidity | 5–20 NTU (well-run) | <1 NTU (typical) |
| Effluent TSS | 10–30 mg/L | <5 mg/L (typically <1 mg/L) |
| COD removal (comparative pilot data) | 54–70% | 89–92% |
| Ammonia stability under SCREEN-OH spikes | Poor — clarifier washout within hours of shock load | Strong — high SRT retains nitrifier population |
| Footprint relative to CAS at same load | 1.0× (baseline) | 0.4–0.6× |
| Sensitivity to NMP/TMAH toxicity shock | High — bulking, clarifier failure | Moderate — membrane protects effluent but biomass activity still depressed |
| CAPEX class | Lower (gravity clarifier, no membranes) | Higher (membrane modules, integrated system) |
| OPEX driver | Sludge hauling, clarifier maintenance | Membrane aeration, CIP chemicals, membrane replacement every 5–10 years |
Three numbers in this table drive the design review decision more than any other: the <5 mg/L effluent TSS from an MBR versus 10–30 mg/L from a well-run CAS directly sets the silt density index (SDI) feed to the downstream RO unit; a CAS plant at 15 NTU will foul RO membranes noticeably faster than an MBR plant at <1 NTU, which over a 5-year RO membrane life cycle can shift the reuse-economics calculation by tens of thousands of dollars. The 0.1 µm pore size on the DF-series flat-sheet module is the specific reason an MBR permeate can be polished by RO without an intermediate multimedia filter. The 8,000–12,000 mg/L MLSS is what buys the long-SRT nitrification stability under the SCREEN-OH ammonia spikes a fab actually generates.
Fab-Specific Pretreatment Requirements Before an MBR
Most MBR failures in fab service originate upstream of the membrane, not in the membrane itself. The pretreatment train must solve four problems before mixed liquor ever reaches the basin.
First, CMP slurry and photoresist solids will blind hollow-fiber and flat-sheet membranes within hours if not screened. Rotary bar screening at 1–3 mm aperture is mandatory per standard MBR design guidance, and a fabric/photoresist float skim step should follow. A HydropureWater GX series rotary bar screen is the practical first unit operation in this train.
Second, HF and high-fluoride streams require calcium precipitation (typically CaCl₂ dosing to pH 8–9) or a dedicated fluoride removal stage ahead of the bioreactor. Fluoride above ~50 mg/L inhibits nitrifying biomass and will collapse ammonia removal inside two to three SRT cycles. F-abrasive ceria slurry from CMP also carries residual oxidizers that must be neutralized before the biomass sees them.
Third, TMAH and NMP toxicity must be managed with equalization blending or dedicated toxicity-tolerant biomass acclimation. TMAH above 100 mg/L is acutely toxic to unacclimated nitrifiers; NMP above 200 mg/L will strip dissolved oxygen and trigger denitrification-driven clarifier failure in a CAS, while an MBR's enclosed aeration tank holds the system together long enough for the biomass to rebound — but only if the equalization basin smooths the slug.
Fourth, oils, photoresist stripper residues, and FOG must be removed by DAF ahead of the bioreactor. A HydropureWater DAF system drops TSS to <30 mg/L and FOG to <10 mg/L before mixed-liquor loading, which is the difference between stable transmembrane pressure and a CIP cycle every 48 hours. The recommended fab train is therefore: rotary bar screen → equalization basin → pH adjustment and fluoride precipitation → DAF for oils and photoresist → biological stage (MBR or CAS) → RO/reuse polishing. Skipping or shortcutting any of these steps converts the MBR advantage into an OPEX penalty.
Saint Petersburg, FL Site and Regulatory Reality Check
Pinellas County POTW pretreatment operates under EPA 40 CFR 403, with local numeric limits enforced through the City of St. Petersburg Sewer Use Ordinance. Typical local limits for an industrial user permit include pH 5.5–10.5, fluoride capped at roughly 50 mg/L at the discharge manhole, ammonia limits negotiated case-by-case, and categorical standards for heavy metals (cadmium, chromium, copper, lead, nickel, zinc) per 40 CFR 433. Fabs discharging through the POTW must install and monitor a side-stream compliance sampler.
Fabs operating a standalone industrial wastewater plant with surface-water discharge fall under an FDEP Industrial Wastewater Permit, which typically tightens BOD/TSS to <20 mg/L monthly average, requires chronic whole-effluent toxicity (WET) testing, and adds reuse-quality requirements if any portion of the flow is destined for landscape irrigation or process reuse. Florida's high water table in Pinellas County, combined with the emphasis on water reuse under Chapter 62-610 F.A.C., pushes most fabs toward RO polishing of MBR permeate. An MBR's sub-1 NTU effluent protects RO membranes far better than CAS effluent at 5–20 NTU, and that single fact often determines the biological-stage choice on its own.
Saint Petersburg–area fabs must also plan for hurricane-season operational resilience between June and November. Both MBR and CAS plants need redundant aeration blower capacity, on-site emergency power, and a membrane CIP chemical inventory that can survive a 7–14 day power interruption. MBR plants have an additional resilience requirement: backup permeate pump capacity and a controlled membrane shutdown procedure to prevent irreversible fouling during extended idle periods.
2026 Selection Framework: When to Pick MBR vs CAS for a Fab
The decision matrix below is built around the four variables that actually drive fab CAPEX reviews: flow variability, footprint, ammonia limit, and reuse intent.
| Fab Condition | Recommended Biological Stage | Reason |
|---|---|---|
| Variable influent (batch CMP, SCREEN-OH spikes, batch etch) | MBR | Long SRT retains nitrifier population through shock loads; sub-1 NTU effluent stays in spec during transients |
| Constrained site footprint (urban Pinellas site, brownfield retrofit) | MBR | 0.4–0.6× the footprint of CAS at the same load (per HydropureWater MBR footprint data, 2026) |
| Discharge to POTW with modest ammonia/BOD limits | CAS or MBR (both viable) | If land is available and CAPEX is the controlling variable, CAS remains a defensible choice |
| Downstream RO polishing for reuse | MBR | <1 NTU effluent reduces RO fouling rate and extends membrane life |
| FDEP Industrial Wastewater Permit (direct discharge) | MBR preferred | Sub-1 mg/L effluent TSS and consistent ammonia compliance under WET testing variability |
| Low flow (≤50 m³/day), steady influent, low ammonia, no reuse | CAS | Lower CAPEX per m³/day, simpler operator skill set, no membrane replacement reserve |
For a typical fab wastewater flow of 50–500 m³/day, an MBR system runs roughly 40–60% of the CAS footprint at the same organic and ammonia loading. The HydropureWater integrated MBR system is rated for 10–2,000 m³/day with 60% footprint reduction versus conventional systems, which puts most fab flow rates inside a single skid envelope and avoids the multi-tank CAS layout. OPEX for an MBR is dominated by membrane aeration energy, periodic CIP chemicals, and membrane replacement on a 5–10 year cycle; CAS OPEX is dominated by waste-activated-sludge hauling and clarifier drive maintenance. The non-obvious risk is that an MBR's footprint advantage evaporates if upstream screening and equalization are skipped — undisciplined CMP slurry in the mixed liquor will force membrane replacement inside 24 months instead of 8 years, and the membrane replacement cost will exceed any OPEX saving the CAS alternative would have delivered. For a deeper look at how a flat-sheet MBR module integrates into a packaged fab reuse train, the DF series flat-sheet MBR membrane module datasheet gives the specific PVDF pore size, panel dimensions, and aeration-box air-demand values to plug into a P&ID.
Frequently Asked Questions
Is MBR effluent always safe to send directly to an RO unit in a fab reuse train?
MBR permeate at <1 NTU and <5 mg/L TSS typically runs an SDI below 3, which most RO membrane manufacturers accept as feed. Fab RO trains still need cartridge filtration (5 µm) and antiscalant dosing ahead of the high-pressure pump, but a multimedia filter is usually unnecessary after an MBR.
What is the realistic membrane replacement interval for a flat-sheet PVDF MBR in fab service?
With disciplined 1–3 mm upstream screening, equalization, and a quarterly CIP, flat-sheet PVDF modules typically run 7–10 years before replacement. Without those steps, replacement can be forced inside 18–24 months, and the OPEX penalty wipes out the MBR's footprint and effluent-quality advantages.
Can a CAS plant be retrofitted to MBR without expanding the aeration basin?
Often yes, because MBR runs 8,000–12,000 mg/L MLSS versus 2,000–4,000 mg/L for CAS in the same basin volume, so the existing tank can absorb the higher biomass load. The retrofit adds membrane modules, a permeate vacuum system, and a CIP skid; secondary clarifiers are typically repurposed as membrane tanks or anoxic zones.
Related Equipment
- HydropureWater integrated MBR system — specifications, capacity range, and technical data
- DF series flat-sheet MBR membrane module — specifications, capacity range, and technical data
- HydropureWater GX series rotary bar screen — specifications, capacity range, and technical data
- HydropureWater DAF system — specifications, capacity range, and technical data