Why Gulf Of America Mining Wastewater Breaks a Straight CAS-vs-MBR Comparison
Mining and metals wastewater in the Gulf Of America is not a scaled-up version of municipal sewage, and treating it like one is the most common reason secondary-treatment retrofits underperform. Typical alumina, copper, zinc, and lead circuit effluents carry total dissolved solids (TDS) in the 1,000–10,000 mg/L range when Gulf Coast formation water is blended into the process, with sulfate commonly 500–3,000 mg/L, hardness 200–1,500 mg/L as CaCO3, suspended clay fines at 200–2,000 mg/L, residual flotation reagents (xanthates, dithiophosphates, thiocyanate), and dissolved heavy metals including As, Pb, Zn, Cu, Hg, and Cd at trace-to-parts-per-million levels. None of those numbers appear in a textbook municipal influent table.
The academic CAS-vs-MBR literature is dominated by municipal and produced-water studies. Mannina et al. (2020) and the broader Bertanza, Karim, and Lares datasets (S3) used domestic sewage with C/N ratios around 10:1, low TDS, and narrow diurnal swings. Mining influent runs 2–5× higher on TSS variability, swings pH between 4 and 10 across a shift, and carries salinity that both floc and membrane surfaces react to. The 50–70% suspended solids removal and 35–40% BOD removal that primary treatment typically delivers (Asante-Sackey et al., 2022, S2) still leaves the secondary stage with a tougher load than any municipal benchmark.
Gulf Of America sites layer in additional non-typical variables: hurricane-season hydraulic surges that can triple influent flow inside 24 hours, brackish intake blending from Mississippi River and Gulf surface water, EPA Region 6 oversight, state-delegated NPDES permits in Louisiana, Texas, Mississippi, Alabama, and Florida, and TMDL-listed receiving waters in most coastal basins. The comparison framework below is built for that matrix, not for a North American suburbs case study.
How a Conventional Activated Sludge Train Is Built for a Mining Site
A conventional activated sludge (CAS) train for a mine site runs equalization → primary clarification → aeration basin → secondary clarifier → disinfection, with return-activated-sludge (RAS) and waste-activated-sludge (WAS) loops tied back to the aeration basin. Typical design points sit at hydraulic retention time (HRT) of 6–24 hours, mixed-liquor suspended solids (MLSS) of 2,000–4,000 mg/L, and solids retention time (SRT) of 5–15 days — numbers that have been standard practice since Jenkins and Wanner (2014) and that every Gulf Of America mechanical contractor can specify from memory (S3).
The secondary clarifier is the weak link in mining service. Heavy, clay-laden floc settles poorly when freshwater dilution drops, and sulfides in the mixed liquor drive filamentous bulking that pushes the sludge blanket into the effluent launder. Solids washout from clarifier upset is the most common 40 CFR 436 inspection finding at base-metals sites, because a 10-minute clarifier overflow-rate excursion can put TSS above the 30 mg/L daily maximum for the rest of the day.
CAS wins on capital cost, energy per cubic meter, and operator familiarity. The 100-year operational history (Jenkins and Wanner, 2014, as cited in S3) means Gulf Of America plant operators can run a CAS basin without specialized training, and spare parts — diffusers, scrapers, weir plates — are stocked at every industrial supply house from Mobile to Port Arthur. CAS loses on footprint, effluent suspended solids, and tolerance of variable influent unless a large equalization basin buffers the swing.
How a Membrane Bioreactor Train Replaces the Clarifier
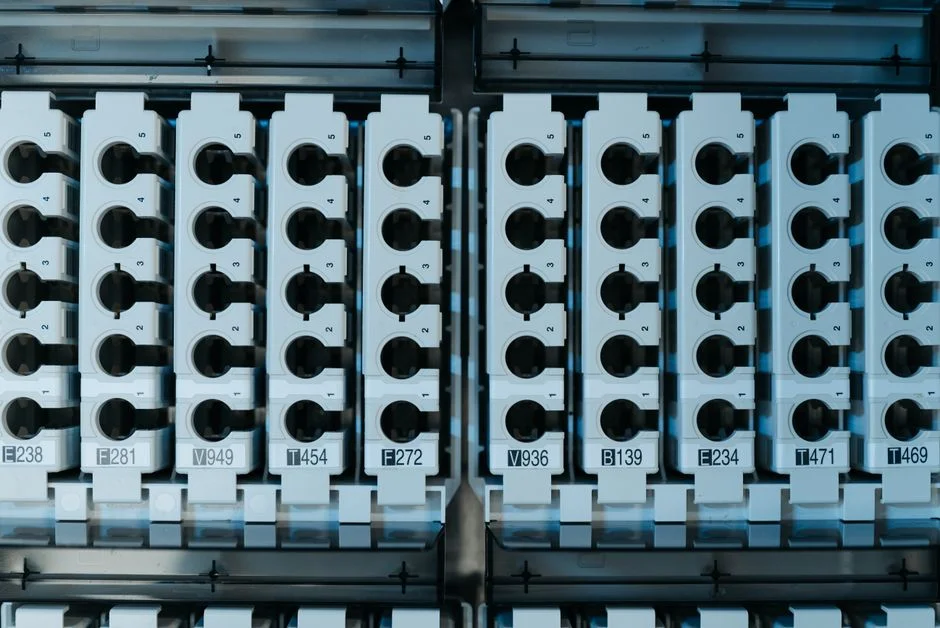
A membrane bioreactor (MBR) for mining service runs equalization → fine screening (typically ≤2 mm aperture) → biological reactor → submerged ultrafiltration membranes → permeate disinfection, with mixed liquor returning from the membrane tank to the bioreactor. Operating windows move up sharply: MLSS of 8,000–12,000 mg/L is normal, SRT extends to 20–60 days, and the membranes — usually PVDF flat sheet or hollow fiber at 0.1–0.4 μm pore size — act as an absolute solids barrier that replaces both the secondary clarifier and most of the downstream polishing step.
An integrated MBR membrane bioreactor system of this configuration is the architecture most mining EPCs are now specifying for greenfield base-metals capacity. Submerged designs deliver a major opex advantage: coarse-bubble aeration below the membrane cassettes both oxygenates the mixed liquor and scours the membrane surface, so the system consumes 10–20× less energy than external cross-flow MBRs that need a separate recirculation pump loop (HydropureWater DF-series module data, 2026).
The longer SRT does real biological work that CAS cannot match. Flotation reagents, thiocyanate, and some weak-acid cyanide complexes that pass through a CAS basin largely intact are partially biodegraded by the slower-growing, specialized biomass that an extended-SRT MBR retains (S3). The honest trade-off is the one every MBR vs CAS study flags: membranes foul, transmembrane pressure rises, chemical clean-in-place (CIP) plus aeration energy drive opex above CAS, and the operator skill set moves from mechanical to process control.
Head-to-Head Parameter Comparison: MBR vs CAS for Mining Effluent
The table below pulls the engineering parameters a capital-request memo needs into one extractable block. Numbers are drawn from S3, S6 verified catalog data, and well-established design ranges for industrial wastewater treatment.
| Parameter | Conventional Activated Sludge (CAS) | Membrane Bioreactor (MBR) |
|---|---|---|
| MLSS | 2,000–4,000 mg/L | 8,000–12,000 mg/L |
| SRT | 5–15 days | 20–60 days |
| HRT (aeration) | 6–24 h | 4–12 h |
| Effluent TSS | 10–30 mg/L (clarifier-dependent) | ≤5 mg/L (membrane barrier) |
| Effluent turbidity | 2–10 NTU | ≤1 NTU |
| Footprint factor | 1.0× (baseline) | ~0.4× (~60% smaller) (S6) |
| Energy demand | 0.3–0.6 kWh/m³ | 0.6–1.0 kWh/m³ |
| Direct GHG emissions | 0.85 kgCO₂eq/m³ (S3) | 0.91 kgCO₂eq/m³ (S3) |
| Sludge yield (observed) | 0.3–0.5 kg TSS/kg COD removed | 0.15–0.30 kg TSS/kg COD removed (S3) |
| Microplastic removal (literature, municipal matrix) | ~1 MP/L effluent (S3) | ~0.4 MP/L effluent (S3) |
| Variable-influent tolerance | Low–moderate (clarifier upset risk) | High (membrane decouples clarification) |
| Reuse enablement (downstream RO) | Often needs UF/RO polishing | Permeate feeds RO directly |
The 0.06 kgCO₂eq/m³ direct-GHG delta in favor of CAS (Mannina et al., 2020, S3) is small but real, and worth flagging to a sustainability-minded Gulf Of America buyer. The microplastic delta from Lares et al. (2018, via S3) matters more each year as EPA Region 6 and Louisiana DEQ begin to scrutinize industrial discharges for emerging contaminants. The footprint factor — MBR at roughly 40% of CAS for the same flow (HydropureWater verified data, S6) — is the single number that most often flips a brownfield or port-side site toward MBR.
40 CFR 436, Metal Finishing, and Gulf Of America Reuse Targets
40 CFR 436 (Ore Mining and Dressing) sets the daily maximum TSS limit at 30 mg/L and pH at 6.0–9.0, and routes toxic pollutants — As, Cd, Cr, Cu, Hg, Ni, Pb, Zn — through the BAT/NSPS framework that drives toward zero discharge of those metals for active operations. Where a satellite metal-finishing line runs on a mine site, 40 CFR 433 applies and tightens the bench marks: Cu daily maximum 2.07 mg/L, Pb 0.69 mg/L, with monthly averages lower still. The defensible move is to benchmark against the stricter of the two standards from day one.
Both CAS and MBR can hit 40 CFR 436 numeric limits, but the operating margin is not the same. MBR permeate at ≤5 mg/L TSS and ≤1 NTU is essentially 6× under the 30 mg/L TSS daily max even on a bad shift, which is exactly the cushion EPA Region 6 inspectors look for when they audit upset events. CAS at 10–30 mg/L is compliant on a calm day and a single clarifier overflow event away from non-compliance on a stormy one. MBR permeate turbidity ≤1 NTU also unlocks downstream reverse-osmosis reuse without an intermediate UF stage — a real economic lever for Gulf Of America coastal sites under pressure to cut freshwater draw.
Decision Framework: When to Choose MBR Over CAS in the Gulf Of America
Use the table below as the decision rule set for a project meeting. Read the rows as scenario triggers, not as marketing criteria — the recommendations are derived from the parameter table above and from the MBR-vs-CAS literature (S3).
| Scenario / site driver | Recommended secondary | Reasoning |
|---|---|---|
| Brownfield or port-side site; footprint constrained | MBR | ~60% smaller footprint (S6); modular containerized skid fits existing pad |
| Reuse in scope (RO, cooling-water makeup, dust suppression) | MBR | ≤1 NTU permeate feeds RO directly; CAS usually needs UF polishing first |
| Influent highly variable (TSS swings, hurricane-season surges) | MBR | Membrane decouples clarification from biology; no clarifier washout risk |
| Strict metals limits or TMDL-listed receiving water | MBR | Wider operating margin under 40 CFR 436 / 433 numeric limits |
| Long-life asset (mine life > ~67 years) | MBR | Higher capex amortizes against consistently excellent effluent (Karim and Mark, 2017, S3) |
| Greenfield land available; discharge-only path | CAS | Lower capex and kWh/m³; simpler operator skill set |
| Limited operator headcount; energy cost high vs. land cost | CAS | 100-year-old process; spare parts common across Gulf Of America contractor base |
| Borderline: want CAS simplicity but reuse-quality effluent | CAS-UF hybrid | CAS followed by UF polishing; alternative explored for Fischer-Tropsch reaction water (S5) |
The 67-year horizon number from Karim and Mark (2017, via S3) is the one to put in front of a long-life bauxite or copper mine manager: above that horizon, MBR's higher capex is fully amortized by consistently better effluent, lower sludge disposal cost, and the avoided cost of a future clarifier or polish-stage retrofit. For a Gulf Of America alumina refinery expecting 40+ years of operation, the math is already on the MBR side of the line. The CAS-UF hybrid row is worth keeping in the option set — see the DAF vs clarifier for mining wastewater guide for the upstream primary-treatment question that often decides whether CAS has enough TSS margin to feed a downstream UF.
Capex, Opex, and Footprint Delta for a Gulf Of America Base-Metals Case
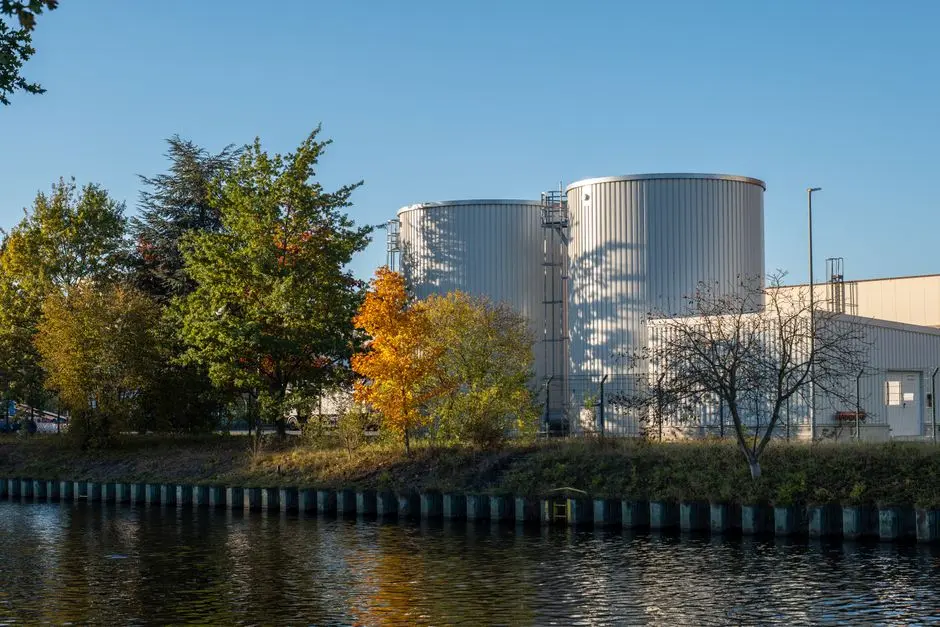
Directional numbers for a representative Gulf Of America base-metals secondary (no primary, no disinfection): MBR capex lands 20–40% above CAS for the same design flow, while footprint compresses to ~40% of CAS (HydropureWater verified catalog data, S6, and corroborated by the MBR-vs-CAS literature in S3). On opex, the recurring items that drive MBR above CAS are membrane replacement on a 5–8 year cycle, CIP chemicals (typically NaOCl plus citric acid), and the ~2× aeration energy penalty versus a CAS basin. Those are partially offset by much lower waste-activated-sludge handling cost, because MBR's lower cell yield (0.15–0.30 versus 0.3–0.5 kg TSS/kg COD removed, S3) cuts hauling and dewatering volume.
For early-phase Gulf Of America mining projects where the financing model is phased capacity build-out, modular containerized MBR skids in the 10–2,000 m³/day range (S6) remove the greenfield capex cliff. A flat-sheet submerged module, like the submerged PVDF flat sheet MBR module in the DF series, is the lower-energy option compared with external cross-flow configurations because coarse-bubble aeration does double duty as membrane scour (Judd, 2016, cited in S3). For a side-by-side pharma-matrix comparison that uses the same footprint-driven framework, the MBR vs CAS footprint guide for pharma wastewater applies the same logic to a different influent envelope. Where brine disposal cost is the binding constraint rather than footprint, the ZLD vs high-recovery RO brine guide covers the downstream concentrate path.
Frequently Asked Questions
Can MBR meet 40 CFR 436 TSS limits for mining wastewater?
Yes. Submerged MBR routinely produces ≤5 mg/L TSS, well below the 30 mg/L daily maximum in 40 CFR 436, and operates at ≤1 NTU turbidity for downstream reuse. (per EPA 40 CFR 436)
Is MBR worth the extra capex for a Gulf Of America mine?
Yes when footprint, reuse, or variable influent are binding constraints. For long-life assets, total cost of ownership favors MBR beyond roughly 67 years of operation because higher initial capex is amortized against consistently excellent effluent quality. (Karim and Mark, 2017, via S3)
How does hypersaline intake water affect MBR vs CAS?
Both systems lose some biological activity above ~10,000 mg/L TDS; MBR retains more biomass at high SRT, but membrane scaling risk rises, so pretreatment softening is advised for hypersaline Gulf Of America intake blending.
What is the smallest HydropureWater MBR skid?
Integrated systems start at 10 m³/day and scale to 2,000 m³/day, and DF-series flat sheet modules produce 32–135 m³/day each. (HydropureWater product data, 2026)
Does MBR help with dissolved metals discharge or only TSS?
MBR is a TSS and solids-bound metals barrier; dissolved metals still require precipitation, ion exchange, or RO polishing. Frame MBR as the biological and physical solids step, not as a complete metals solution. (per EPA 40 CFR 436 / 433 framework)