Why Cooling-Tower Blowdown Is a 2026 Campus-Utility Decision, Not a Single-Tower Problem
For a 2026 hyperscale data center campus, reverse osmosis wins on OPEX for cooling-tower blowdown reuse: BWRO with controlled-precipitation concentrate treatment reaches ~95% overall recovery and ~1 mg/L silica permeate (per IDE MAXH2O industrial case), pushing cycles of concentration from 4 to 6–7 and cutting blowdown volume by roughly 60–70%. Sodium-cycle ion exchange can polish low-TDS streams but generates 5–15% regeneration-waste volume that re-enters the same discharge problem BWRO concentrates already solved.
The reason this comparison has to happen at the campus-utility level is scale. A 100 MW facility can use up to ~2 million liters of water per day (ide-tech.com, 2026) — and on a real hyperscale site there are dozens of hybrid cooling towers whose blended blowdown, not any single tower's purge, is the reuse stream a treatment skid has to handle. Picking a softener off one tower's datasheet and scaling it to campus is how projects fail commissioning.
The second reason is geography. Arid-region hyperscale sites — the U.S. Southwest, the Middle East, parts of Asia — sit in basins where data centers compete directly with municipal and agricultural users for the same freshwater (ide-tech.com, 2026). Water reuse has moved from ESG talking point to baseline site-permit requirement in many of these jurisdictions by 2026, and that shifts the decision from "is reuse nice to have?" to "which reuse train pencils out under our discharge limits?"
The third reason is the chemistry. Cooling-tower blowdown is a brackish stream enriched in silica, CaCO3, and CaSO4 from evaporative concentration (ide-tech.com, 2026) — these three species are the entire reason a generic IX vs RO comparison breaks down. Softener selection and RO recovery limits are both set by the same three solubility curves, which is why this is a process-engineering decision, not a catalog pick.
Stated as one sentence: the campus-utility question is whether to polish a blended, silica-limited CTBD stream with sodium-cycle IX and send regeneration waste to on-site treatment, or deploy BWRO with concentrate management and reuse the permeate as cooling make-up. The rest of this article is the math and the exceptions.
Cycles of Concentration Drive the OPEX Case for Either Technology
Cycles of concentration (COC) is the ratio of dissolved solids in the circulating cooling water to dissolved solids in the make-up water. Blowdown flow is roughly the evaporation rate divided by (COC − 1), so every additional cycle cuts both make-up water and blowdown roughly in inverse proportion. OPEX scales with both line items: pump energy, pretreatment chemical, and discharge fees all fall as COC rises, which is why the entire RO vs IX question collapses into "which train holds the highest COC at the lowest combined treatment-plus-waste cost per cubic meter of make-up water saved."
Worked example for a 100 MW campus, ~2 million L/day total water demand (ide-tech.com, 2026), with evaporative cooling accounting for ~70% of that — so about 1.4 million L/day of evaporation. At COC = 4 (a typical unpolished tower), blowdown is roughly 1,400,000 / (4 − 1) ≈ 467,000 L/day and make-up is evaporation plus blowdown ≈ 1.87 million L/day. At COC = 7, blowdown drops to 1,400,000 / (7 − 1) ≈ 233,000 L/day and make-up falls to ~1.63 million L/day. Raising COC from 4 to 7 cuts make-up water by ~13% and blowdown volume by ~50% in this case — and on a tower that is silica-limited (where unpolished operation often caps at COC 4), the gain in blowdown reduction routinely reaches the 60–70% range once a polishing train is added (ide-tech.com, 2026). Both line items hit OPEX directly.
| Parameter | COC = 4 (baseline) | COC = 6 (IX polish) | COC = 7 (BWRO polish) |
|---|---|---|---|
| Evaporation (L/day) | 1,400,000 | 1,400,000 | 1,400,000 |
| Blowdown (L/day) | ~467,000 | ~280,000 | ~233,000 |
| Make-up (L/day) | ~1,867,000 | ~1,680,000 | ~1,633,000 |
| Blowdown reduction vs COC 4 | — | ~40% | ~50–70%* |
| Permeate silica target (mg/L) | n/a | 10–30 (IX limited) | ~1 (BWRO with controlled precipitation) |
*Silica-limited CTBD with no polish typically caps below COC 4; the 60–70% range applies when the baseline is unpolished operation at COC 3–4.
The OPEX framing is explicit: the winning technology is whichever one lets the operator hold the highest COC at the lowest combined (treatment cost + waste-disposal cost) per cubic meter of make-up water saved. Everything that follows — the IX process flow, the BWRO process flow, the head-to-head table — is a way of putting a number on those two cost lines.
Process Flow A: Sodium-Cycle Ion Exchange on Blended CTBD
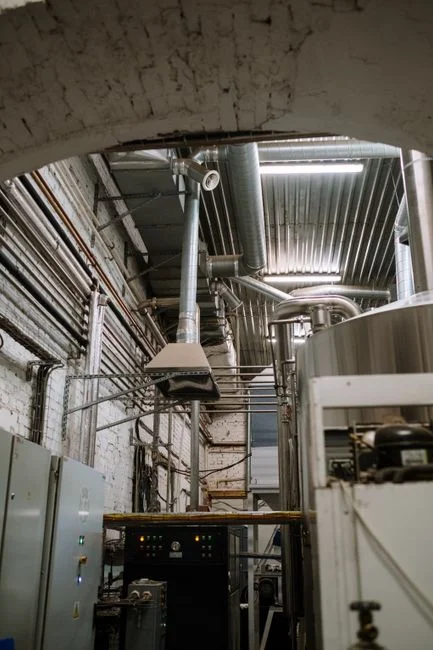
A sodium-cycle IX polishing loop for blended CTBD typically runs as multimedia filter → sodium-cycle softener (strong-acid cation, SAC) for Ca/Mg removal → optional weak-acid cation (WAC) for alkalinity reduction → degasifier for CO2 → mixed-bed or separate WAC/WBA polisher when low-TDS permeate is required. On a hyperscale campus the SAC is often a packaged industrial water softener train operating in parallel lead-lag with a duty/standby spare so one vessel can regenerate without interrupting polished-water delivery to the cooling make-up header.
Regeneration is the OPEX-determining step. Standard practice is 8–15% NaCl brine at roughly 120–160 g NaCl per liter of resin, 30–60 minute cycle, followed by slow rinse then fast rinse. Total regeneration water plus rinse is typically 5–15% of treated throughput, and the waste stream is high in NaCl plus whatever the resin stripped during the service run — hardness, alkalinity, trace metals. On a hyperscale campus with limited NPDES headroom, that brine is often sent to on-site RO or a brine evaporator, which is the same downstream disposal problem BWRO has already engineered around.
The silica problem is the showstopper. Strong-acid cation does not remove silica; WAC reduces alkalinity but does not precipitate silica reliably. At COC > 5 the polishing loop must deal with 50–150 mg/L SiO2 in the feed, or that silica leaks through to the cooling loop and scales the tower fill. This is why IX-only trains on raw CTBD rarely push past COC 5–6 — silica, not hardness, is the binding constraint, and IX does not solve it.
| Parameter | Typical operating range | Notes |
|---|---|---|
| Resin type | Strong-acid cation (Na-form) | Standard for hardness removal |
| Brine concentration | 8–15% NaCl | ~120–160 g NaCl per L resin |
| Working capacity | ~30 g CaCO3/L resin | Drives salt consumption |
| Regeneration cycle | 30–60 min + rinse | Lead-lag duplex typical |
| Regeneration waste | 5–15% of treated throughput | High NaCl + stripped ions |
| Silica removal | None (SAC) / partial (WAC) | Limits COC to ~5–6 on CTBD |
Process Flow B: Reverse Osmosis on Blended CTBD
A modern BWRO train for CTBD runs equalization + strainer → multimedia filter → cartridge filter → UF (PVDF, 0.03 µm) as RO pretreatment → antiscalant dosing (typically phosphonate-based) → BWRO skids → CIP system. The HydropureWater UF pretreatment skid in the 2,000–40,000 L/h range is a typical building block, paired with a HydropureWater industrial RO system capable of recovery up to 95% with energy recovery on the concentrate stream.
Recovery is the number that anchors any cost comparison. Conventional BWRO plateaus at 75–80% recovery before silica, CaCO3, and CaSO4 scaling becomes unmanageable on raw CTBD (ide-tech.com, 2026) — beyond that, antiscalant demand rises sharply, CIP frequency shortens, and membrane life drops. High-recovery variants change the math in two ways: a two-stage RO with interstage boosting pushes the ceiling, and a controlled-precipitation brine desalter intentionally precipitates silica, CaCO3, and other sparingly soluble salts as compact pellets in a fluidized-bed reactor. With the scaling species removed as solids, the remaining brine is mostly NaCl and can be pushed to ~95% overall recovery with permeate silica around 1 mg/L (ide-tech.com MAXH2O case, 2026). That permeate is then suitable for direct blending back into cooling make-up.
Energy and consumables are the second-order numbers. RO at 75–80% recovery on brackish CTBD sits at ~0.7–1.2 kWh/m3 feed, dominated by the high-pressure pump. Membrane replacement is typically amortized at ~5–10% of CAPEX per year, depending on feed quality and CIP discipline. CIP chemicals — usually 2% citric acid plus an alkaline detergent — are needed every 1–3 months. UF backwash water is ~5–10% of feed (HydropureWater UF spec), and antiscalant dose is sized to keep the concentrate stream just below the silica and CaSO4 saturation indices.
| Parameter | Conventional BWRO | High-recovery BWRO + brine desalter |
|---|---|---|
| Recovery | 75–80% | ~95% |
| Permeate silica | 5–20 mg/L | ~1 mg/L |
| Concentrate volume (% feed) | 20–25% | 5–10% |
| Concentrate TDS vs feed | 4–5× | 4–5× (mostly NaCl after precipitation) |
| Specific energy | 0.7–1.2 kWh/m3 feed | 0.8–1.4 kWh/m3 feed (with ERD) |
| CIP frequency | Every 1–3 months | Every 1–3 months |
The concentrate stream is the OPEX line that determines whether the project pencils out. At 75–80% recovery it is 20–25% of feed with TDS concentrated 4–5×; at 95% recovery it drops to 5–10% of feed and is dominated by NaCl, which makes downstream zero-liquid-discharge (ZLD) crystallization far more efficient. The detailed mechanical and selection logic behind the RO step is covered in the RO membrane system specifications and selection guide — for this comparison the relevant takeaway is that the concentrate line item, not membrane replacement, is what flips the project from red to green.
Head-to-Head OPEX Comparison on a Hyperscale Campus
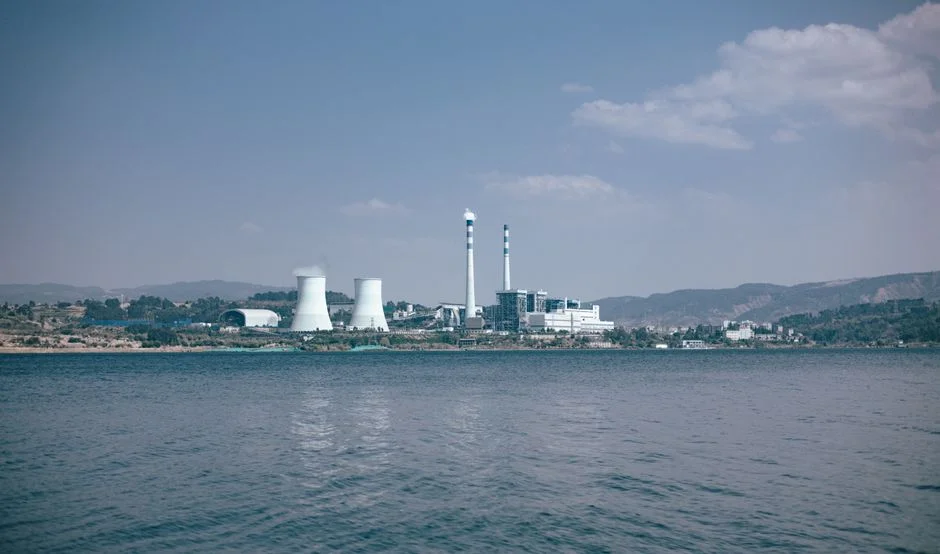
The 1979 EPA assessment of three CTBD treatment options — reverse osmosis, vapor compression evaporation, and vertical-tube foaming evaporation — flagged RO as the lowest energy and lowest $/kgal of purified water among the three, but explicitly "very sensitive" to pretreatment (nepis.epa.gov, 1979). That ranking direction is still correct in 2026; the absolute 1979 dollars must be escalated by IPF/CPI before they enter a current CAPEX model, and pretreatment sensitivity is now addressed with UF upstream of the RO membranes rather than the lime/soda clarification chain the 1979 design assumed.
For a 2026 campus OPEX model, the dominant IX line is salt. At 250 g NaCl per liter of resin and a working capacity of ~30 g/L, expect ~8 kg NaCl per cubic meter of throughput for full regeneration; for a 50 m3/h train that is ~9.6 t/day of salt plus an equal volume of brine plus rinse to dispose of. The dominant RO lines are energy (~0.7–1.2 kWh/m3 feed at 75–80% recovery) and concentrate disposal. At 95% recovery, concentrate volume drops by 50–75% versus conventional BWRO, and that single line item is usually what flips the project from red to green when discharge fees are non-trivial.
| OPEX line | Sodium-cycle IX on CTBD | BWRO (75–80% recovery) on CTBD | High-recovery BWRO + brine desalter |
|---|---|---|---|
| Target COC achievable | 5–6 (silica-limited) | 6–7 | 6–7 (with 1 mg/L permeate silica guardrail) |
| Treatment energy | ~0.2–0.3 kWh/m3 feed (pumps) | ~0.7–1.2 kWh/m3 feed | ~0.8–1.4 kWh/m3 feed (with ERD) |
| Chemical OPEX | ~8 kg NaCl per m3 throughput at full regen | Antiscalant (phosphonate), acid for CIP | Antiscalant + precipitation chemistry (lime/soda or equivalent) |
| Resin/membrane replacement | ~5–10% of CAPEX/yr | ~5–10% of CAPEX/yr | ~5–10% of CAPEX/yr |
| Labor (h/week) | 8–16 (regeneration scheduling) | 12–24 (CIP, antiscalant tuning) | 16–30 (desalter + RO) |
| Waste volume (% of feed) | 5–15% (brine + rinse) | 20–25% (concentrate) | 5–10% (concentrate, mostly NaCl) |
| UF pretreatment required | No (multimedia sufficient) | Yes (UF, 0.03 µm PVDF) | Yes (UF, 0.03 µm PVDF) |
Verdict line, defensible to finance: at COC ≥ 6 and with any on-site discharge constraint, BWRO with high-recovery concentrate management wins on 5-year OPEX; IX wins only when feed TDS is already low (e.g., <300 mg/L), silica is <20 mg/L, and the campus has either a brine evaporator or a sewer connection for regeneration waste. The cross-process OPEX comparison for the broader API and formulation space is covered separately in our 2026 RO vs ion exchange OPEX verdict for cooling blowdown reuse; the underlying IX cost model is in the ion exchange engineering specs and cost models reference.
Decision Framework: When IX Still Beats RO on a Data Center Campus
Headline verdicts are useful until the first exception. The four cases below are where a campus engineer should ignore the default RO recommendation and put IX in front of finance instead.
Rule 1 — existing brine disposal with zero marginal cost. If the campus already holds a Class I deep-well injection permit for brine, or has a sewer connection with no discharge fee per cubic meter, IX and RO OPEX converge and IX wins on simplicity, smaller footprint, and shorter commissioning. The IX regeneration brine stops being a liability once disposal is essentially free.
Rule 2 — pre-diluted, low-TDS, low-silica CTBD. If the CTBD stream is already pre-diluted to <300 mg/L TDS and <20 mg/L silica — for example, a hybrid dry-cooled site that only runs its wet-mode towers intermittently — sodium-cycle IX is enough to hit COC 5–6 with no RO skid, no UF pretreatment, and no CIP stack. The OPEX case for RO depends on the silica ceiling; if silica is not binding, the IX case gets materially stronger.
Rule 3 — small edge data center, no on-site water engineer. If the project is a single small (<2 MW) edge data center with no on-site water engineer, IX with a service contract is lower operational risk than a UF + BWRO + CIP stack. A regenerable softener can run on a quarterly service visit; an RO skid at low utilization is more likely to be mis-operated than to fail outright.
Rule 4 — ZLD or near-ZLD by 2026. If the hyperscale campus is targeting ZLD or near-ZLD, BWRO concentrate feeds the brine crystallizer more efficiently than IX regeneration brine, because the RO concentrate is already a single-salt (mostly NaCl) stream after controlled precipitation (ide-tech.com, 2026). The downstream crystallizer is the unit operation that sets the OPEX in a ZLD scheme, and RO sets it up better than IX.
Frequently Asked Questions
What cycles of concentration should a data center cooling tower target with RO-treated blowdown?
Aim for COC 6–7 with BWRO permeate as make-up, using 1 mg/L permeate silica as the guardrail. At COC 6 the typical CTBD stream stays below CaCO3 and CaSO4 saturation indices and the silica ceiling is not binding. Above COC 7 the antiscalant dose and CIP frequency rise sharply.
Why does conventional BWRO stop at 75–80% recovery on cooling tower blowdown?
Silica, CaCO3, and CaSO4 hit their scaling thresholds in the concentrate stream before recovery can climb higher. High-recovery designs work around this by using controlled precipitation in a brine desalter to remove the scaling species as solids, allowing the remaining NaCl-dominant brine to be pushed to ~95% overall recovery.
How much regeneration waste does a sodium-cycle softener produce on CTBD?
Typically 5–15% of treated volume as NaCl brine plus rinse, with hardness and alkalinity loadings. For a 50 m3/h SAC train running on CTBD, expect ~9.6 t/day of salt and a similar volume of brine plus rinse to dispose of, which on a hyperscale campus usually routes to on-site RO or a brine evaporator.
Which is cheaper per cubic meter, RO or ion exchange, for cooling blowdown reuse in 2026?
For blended CTBD at hyperscale, BWRO with high-recovery concentrate management is cheaper on 5-year OPEX, driven by the concentrate-disposal line item. IX is competitive only on low-TDS, low-silica feeds, on sites with essentially free brine disposal, or at small edge sites where operational simplicity outweighs per-cubic-meter cost.
Can RO and ion exchange be combined on cooling tower blowdown?
Yes — IX as RO pretreatment (typically a sodium-cycle softener plus a WAC for alkalinity reduction) is a common configuration to push RO recovery and lower antiscalant dose. The combination is the standard answer when feed hardness and alkalinity would otherwise force a low recovery ceiling on the RO step.