Why Dyeing Wastewater Breaks Conventional Activated Sludge
The 2024 pilot at a 50,000 m³/d jeans-production dyeing WWTP in China fed mixed liquor to MBR cassettes with an influent profile that no conventional activated sludge (CAS) basin was designed to handle: pH 11–14, total COD 1,000–1,500 mg/L, soluble chromaticity 400–500 dilution times, suspended solids 400–600 mg/L, and sulfide 20–50 mg/L (S5). The pollution is dominated by poorly biodegradable reactive dyes and auxiliaries — azo, anthraquinone, and phthalocyanine chromophores that resist oxidative cleavage in a standard aeration tank — plus the high-TDS salt bath discharges that arrive in shock loads from batch dyeing.
Reactive azo dyes carry sulfonate groups designed to bond covalently to cellulose, which is exactly what makes them hard to mineralize biologically. Anthraquinone and phthalocyanine chromophores are aromatic, planar, and toxic to the heterotrophs that drive floc formation. The result in a CAS train is well documented: partial decolorization in the aeration tank, then a high-color secondary clarifier overflow because soluble dye molecules do not settle with the floc. The pilot authors state it directly — "textile dyeing wastewater contains dyes and auxiliaries with poor biodegradability, often rendering conventional secondary biological treatment processes (i.e., activated sludge or biofilm) incapable of achieving effluent stable compliance with discharge standards" (S5).
Salt and TDS variability layer a second failure mode on top. Sudden conductivity spikes from a black-dye batch disrupt floc structure, trigger pin floc, and wash biomass out of the clarifier weirs. TSS carryover then forces any downstream sand filter or polishing step to overbuild, and the operator lengthens the clarifier residence time to compensate — exactly the opposite of what a tight plot allows.
How an MBR Solves the Color, TSS, and TDS Problem
An MBR couples the same activated-sludge biology as CAS with submerged microfiltration or ultrafiltration membranes in the 0.1–0.1 μm pore range, eliminating the secondary clarifier entirely (S3, S5). For a dyeing line that means the hydraulic retention time (HRT) is decoupled from sludge settling velocity — flocs that would wash over a clarifier weir are simply retained on the membrane surface and returned to the aeration basin.
That decoupling lets the basin run at mixed-liquor suspended solids (MLSS) of 8,000–15,000 mg/L versus roughly 3,000–4,000 mg/L in a CAS aeration tank. Higher biomass means a higher volumetric loading rate at the same effluent quality, which shrinks the aeration volume per m³/day. The DF series flat-sheet membrane modules in the HydropureWater catalog hold 0.1 μm PVDF elements in cassettes sized 80–225 m², producing 32–135 m³/day per cassette depending on the operating flux.
On synthetic Reactive Red 390 feed, a conventional MBR reached 93.1% COD removal and 87.1% color removal, while a moving-bed MBR variant (MB-MBR) hit 98.5% COD and 89.5% color with no physical or chemical cleaning across the operating period — the moving carriers scoured the membrane surface and kept EPS polysaccharide concentrations low (S4). On real dyeing effluent, the S5 pilot placed flat-sheet cassettes in the terminal zone of the aeration tank at a sustainable flux of 15 L/(m²·h) and MLSS ≤15,000 mg/L; the MBR alone dropped soluble chromaticity from 400–500 dilution times to 60–120, and pairing the MBR with RO pushed overall color removal to 95.6% and COD to 89.1% (S5).
Footprint and Flow: CAS vs MBR Side by Side
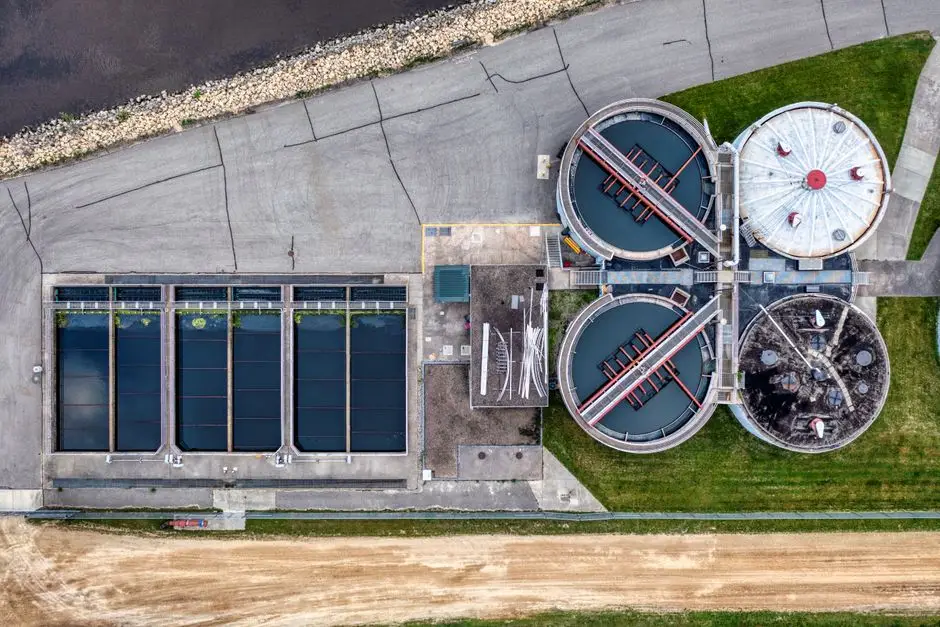
The answer to "which wins on a tight plot" is read directly off the table below. The HydropureWater integrated MBR system is specified at 60% smaller footprint than conventional designs for 10–2,000 m³/day capacities (S6). Applying that ratio to typical CAS footprint bands — 0.6–0.9 m² per m³/day for a 1,000 m³/d dyeing line including aeration, clarifier, and RAS/WAS channels — gives the comparison the engineer needs to defend the MBR capex to a plant owner.
| Design flow (m³/day) | CAS typical footprint (m²) | MBR integrated footprint (m²) | Footprint reduction | MBR color removal | MBR COD removal | Effluent TSS | Reuse-ready with RO? |
|---|---|---|---|---|---|---|---|
| 500 | 300–450 | 120–180 | ~60% | 87–90% (synthetic), 95.6% with RO (real effluent) | 93–98% | <1 NTU turbidity, TSS negligible | Yes |
| 1,000 | 600–900 | 240–360 | ~60% | 87–90% (synthetic), 95.6% with RO (real effluent) | 93–98% | <1 NTU turbidity, TSS negligible | Yes |
| 2,000 | 1,200–1,800 | 480–720 | ~60% | 87–90% (synthetic), 95.6% with RO (real effluent) | 93–98% | <1 NTU turbidity, TSS negligible | Yes |
Two things to flag for the EPC consultant. First, the CAS column is a typical engineering band, not a measured value from a single site — civil works, sludge storage, and odor control vary by jurisdiction. Second, footprint alone is not the whole answer: an MBR tank holds DF flat-sheet cassettes that occupy plan area at roughly 0.06–0.11 m² per m³/day of membrane capacity (32–135 m³/day per 80–225 m² cassette), which the engineer should sanity-check against the membrane-tank dimensions during detailed design.
Operating Envelope: Flux, Cleaning, and Membrane Care
For the plant manager's review, the operator-side numbers are what close the deal. The S4 head-to-head study and the S5 pilot data together define a defensible operating envelope for an MBR on dyeing effluent.
| Parameter | Conventional MBR (S4) | Moving-bed MBR (S4) | S5 pilot recommendation |
|---|---|---|---|
| Cleaning frequency | Offline physical every 2 days; chemical every 15 days | None required across operating period | Maintain flux ≤18 L/(m²·h) to avoid cake-layer fouling |
| COD removal | 93.1% (Reactive Red 390) | 98.5% | 52.5% (PVDF), 56.8% (PES) membrane rejection alone; 89.1% with RO downstream |
| Color removal | 87.1% | 89.5% | Effluent chromaticity 60–120 dilution times from 400–500 feed |
| TMP at high flux (22.5 L/(m²·h)) | — | — | PVDF: 4 kPa → 30 kPa, +3 kPa/d; PES: 9 kPa → 42 kPa, +3.4 kPa/d |
| Sustainable flux | — | — | ≤18 L/(m²·h) at MLSS ≤15,000 mg/L |
| MLSS | 8,000–12,000 mg/L typical | 8,000–12,000 mg/L typical | ≤15,000 mg/L maximum |
Material choice matters on dyeing effluent. PVDF climbed from a 4 kPa baseline to 30 kPa TMP at 22.5 L/(m²·h), while PES rose further to 42 kPa with a 0.15 kPa/d creep already visible during the 15 L/(m²·h) stage — a sign of stronger foulant–membrane interaction in PES (S5). The broader MBR literature notes "low sludge production and high stability during extreme purification" as a defining advantage of MBR over CAS (S3), and that stability is exactly what batch dyeing demands.
TDS Reality Check: What MBR Can and Cannot Do

An MBR is a biological reactor plus a physical barrier with pores of 0.1 μm. Sodium, chloride, and sulfate ions pass through essentially unchanged — TDS rejection is not what microfiltration or ultrafiltration does. If the project deliverable is salt reduction for reuse, an MBR alone is not the answer.
The S5 pilot makes the chain explicit: MBR with ceramic-membrane polishing plus RO achieved 89.1% COD and 95.6% color removal, and the RO permeate was suitable for feeding back into the dyeing process (S5). The industrial RO system sits downstream of the MBR for that reason — color and organics come off in the MBR, dissolved salts come off in the RO.
For an engineer sizing the train: if the discharge limit is on TDS or if the owner wants to recycle process water, budget for RO. If the only driver is color, COD, and TSS on a tight plot, the MBR alone meets the secondary-treatment brief and the RO can be deferred.
When CAS Still Wins on a Footprint-Constrained Site
MBR is not the universal answer. Three cases where CAS remains the rational choice:
- Brownfield with a working clarifier. If a site already has a functional aeration basin and secondary clarifier, retrofitting an MBR is a separate capex line — not a free upgrade. Polishing the existing CAS train with coagulant dosing or a sand filter often returns better value.
- Very large flows where civil cost dominates. Above roughly 5,000 m³/day, the 60% footprint saving on the secondary stage becomes a smaller share of total plot area, and CAS retains an OPEX advantage on membrane replacement (every 5–8 years for PVDF).
- Discharge-only to a municipal sewer with no reuse. When reuse is off the table and the receiving sewer has capacity, the RO block is unjustified, and the MBR's effluent-quality advantage over CAS narrows to TSS and color — both of which a clarifier plus polymer can handle.
The S5 site itself is the worked example. It ran CAS + secondary clarifier + ozonation + constructed wetland to meet GB 4287-2012 on the original 50,000 m³/d flow. The MBR + RO upgrade was triggered only by a planned 25,000 m³/d capacity expansion plus 30,000 m³/d of reuse water for the industrial zone — not by a failure of the existing CAS line (S5).
Selection Checklist for Footprint-Constrained Dyeing Sites
Five conditions that, individually or together, point to MBR over CAS for a 2026 textile dyeing project:
- Influent chromaticity exceeds 300 dilution times. The S5 feed of 400–500 dilution times confirmed stable compliance was not achievable by CAS alone (S5).
- The owner wants reuse water for the dyeing line. MBR effluent plus industrial RO polish delivered 89.1% COD and 95.6% color removal on real effluent (S5).
- Available plot is under 0.3 m² per m³/day. At that density, an MBR delivers the required hydraulic capacity with a clarifier footprint that simply does not exist; CAS cannot match it without civil expansion.
- TDS or salt-shock variability is high. Batch dyeing produces conductivity swings that disrupt CAS floc; MBR holds MLSS up to 15,000 mg/L independent of settling (S5).
- Capex budget supports membrane replacement every 5–8 years. PVDF flat-sheet modules have a defined service life and the operator must plan for it.
For typical 500–2,000 m³/day dyeing lines on tight plots in 2026, the integrated MBR system is the default secondary treatment, with RO added when reuse or TDS reduction is in scope. For an operator-side comparison of MBR against moving-bed biofilm reactors on a different effluent, the MBR vs MBBR for pharma wastewater guide walks through the same decision logic on pharma feed. For capex and membrane-life numbers on a different heavy-industrial effluent, the MBR cost and OPEX guide for industrial wastewater is a useful cross-check.
Frequently Asked Questions
Does MBR remove TDS from textile dyeing wastewater?
No. MBR is biological treatment plus microfiltration or ultrafiltration (0.1 μm pores); dissolved salts pass through essentially unchanged. For TDS reduction or reuse, pair the MBR with a downstream industrial RO system, as the S5 pilot did to reach reuse-grade permeate.
What color removal can MBR achieve on textile dyeing wastewater?
On synthetic Reactive Red 390 feed, conventional MBR reached 87.1% color removal and the moving-bed MBR variant hit 89.5% (S4). On real dyeing effluent with RO polishing downstream, the S5 pilot measured 95.6% overall color removal.
How much smaller is an MBR than a CAS plant of the same capacity?
HydropureWater's integrated MBR system is specified at roughly 60% smaller footprint than conventional designs across the 10–2,000 m³/day range (S6). For a 1,000 m³/day dyeing line that translates to a footprint of about 240–360 m² versus 600–900 m² for a CAS train of equivalent capacity.
What is the sustainable membrane flux for textile dyeing MBR?
The S5 pilot recommends ≤18 L/(m²·h) for the flux envelope. At 22.5 L/(m²·h), both PVDF and PES membranes showed cake-layer fouling with TMP rising at 3–3.4 kPa/d, characteristic of super-critical flux operation.
Can MBR be retrofitted into an existing CAS basin?
Yes. The S5 pilot placed PVDF and PES flat-sheet cassettes in stainless-steel tanks adjacent to the existing aeration basin, with mixed liquor pumped from the terminal zone. The modular design supports phased retrofit on operating sites without taking the secondary stage offline.