Why Pharmaceutical Effluent in Uganda Needs a Different Treatment Train
Pharmaceutical effluent in Uganda consistently pushes the 20–95% pollutant-removal band reported by Dawood et al. (2023) toward its lower end, and a plant designed only to the median of that band will fail Uganda's binding discharge rules (Dawood et al., Environmental Protection Research, 2023-04). The regulatory triangle that controls every ETP around Namanve, Bweyogerere, Luzira, and the Kampala industrial parks is the National Environment (Waste Management) Regulations 2020, the National Environment Act 2019, and East African Community standard EAS 12:2023 — three documents that converge on COD ≤ 100 mg/L, BOD ≤ 30 mg/L, and TSS ≤ 30 mg/L for surface-water discharge. Generic S2/S4 academic trains built around UASB or MBR alone are not designed against this limit set; they are designed for removal-rate reporting.
Uganda's dominant pharmaceutical sub-sectors are generics formulation, artemisinin-based combination therapies (ACTs) for malaria, antiretrovirals (ARVs), beta-lactam and macrolide antibiotics, and veterinary vaccines. Each generates a different solvent, salt, and active pharmaceutical ingredient (API) profile, which means equalisation and pre-treatment sizing cannot be copy-pasted from a textbook. Operating risks compound the design challenge: Uganda's grid experiences routine 6–12 hour outages, ambient temperature sits at 22–28 °C year-round (favouring mesophilic biology but stressing membrane flux), and imported coagulants, polyacrylamide, and calibration reagents routinely face 3–6 week clearance delays through Mombasa or Dar es Salaam. A treatment train that ignores these realities will run out of chemicals, lose its biomass, or fail a NEMA composite sample within the first quarter.
Pharmaceutical Wastewater Characteristics Ugandan Plants Must Design For
COD in Ugandan formulation effluent typically falls between 1,500 and 8,000 mg/L, while API synthesis streams — antimalarial and ARV actives — can reach 25,000 mg/L (Li et al., Journal of Water Process Engineering, 2024-06). That gap is the first design decision: the same equalisation basin cannot serve both. BOD₅/COD ratios of 0.2–0.4 for chemical-synthesis streams confirm what Li et al. (2024) describe as effluent that is "highly toxic and difficult to be purified" — aerobic biology alone will not close the carbon balance, and an advanced oxidation step must be budgeted from day one.
Total nitrogen routinely measures 50–800 mg/L, with chloride salinity of 5–20 g/L from API manufacture and ion-exchange regenerant discharge. Both parameters suppress nitrifiers and require acclimatised biomass seeded from saline-tolerant inocula. pH swings between 2 and 11 are common when acid-wash and alkaline-cleaning batches discharge in the same shift, and intermittent slug loads of 50–200 mg/L of antibiotics or cyanide from quality-control laboratories can pass through an inadequately sized equalisation basin in under one hour. Residual APIs and antibiotic resistance genes (ARGs) flagged by Li et al. (2024) as a "potential threat to human health" are not removed by standard chlorination at the residuals NEMA allows; ARG monitoring is emerging in 2026 audit practice and should be specified into the laboratory scope from project kick-off.
| Parameter | Formulation range | API synthesis range | NEMA 2020 surface-water limit | Design removal target |
|---|---|---|---|---|
| COD (mg/L) | 1,500–8,000 | 8,000–25,000 | ≤ 100 | ≥ 95% |
| BOD₅ (mg/L) | 600–2,500 | 2,000–6,000 | ≤ 30 | ≥ 95% |
| TSS (mg/L) | 200–1,500 | 500–3,000 | ≤ 30 | ≥ 95% |
| Total nitrogen (mg/L) | 50–200 | 200–800 | ≤ 20 (proposed 2026) | ≥ 80% |
| Chloride (g/L) | 1–5 | 5–20 | ≤ 1.0 | RO polish or blend |
| pH | 4–10 | 2–11 | 6–9 | Inline correction |
The Uganda-Tuned Process Train: Equalisation to Polishing
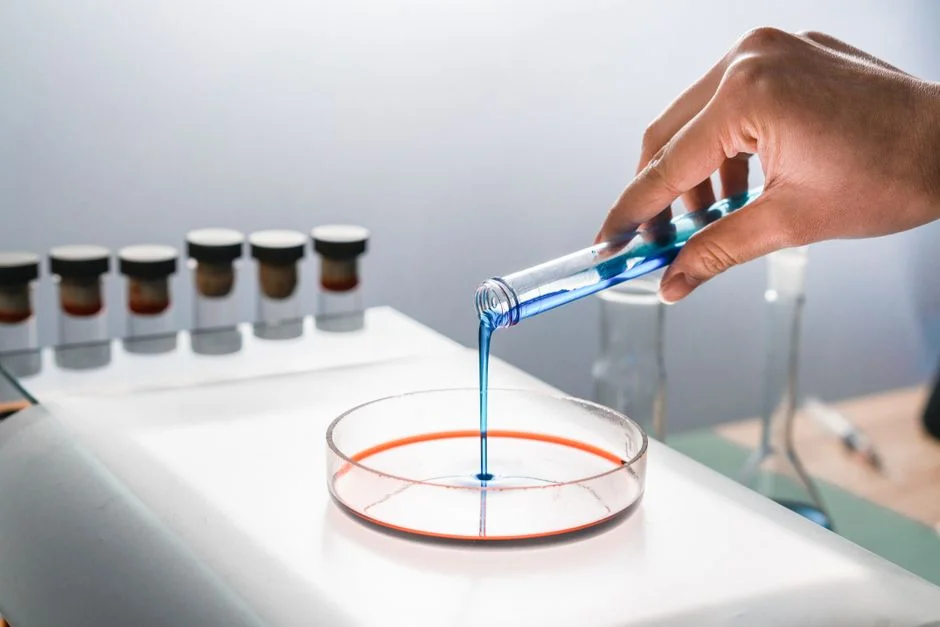
Stage 1 — Screening and equalisation. A rotary bar screen at 5–10 mm aperture protects downstream pumps, followed by an equalisation basin sized for 12–24 h hydraulic retention time. At a typical Kampala 200 m³/day plant, that is 100–200 m³ of live storage — large enough to absorb a full batch-discharge slug and small enough to fit a standard 20 ft containerised skid footprint for civil works savings.
Stage 2 — Physico-chemical pre-treatment. Inline pH correction to 6.5–7.5 with sulphuric acid or caustic dosing is followed by coagulant (polyaluminium chloride, PAC, 50–150 mg/L) and polyacrylamide flocculant (0.5–2 mg/L) feeding a dissolved air flotation unit. DAF surface loading rates of 15–20 m/h reliably cut TSS by 70–85% and strip a significant fraction of colloidal API carryover before biology sees it. Dawood et al. (2023) note that combined processes dominate effective PWW treatment; this stage is the load-shedding foundation for everything downstream.
Stage 3 — Biological treatment. Two credible choices exist for a 2026 Ugandan plant. An integrated MBR membrane bioreactor with submerged 0.1–0.4 µm PVDF membranes delivers ~60% footprint reduction versus conventional activated sludge, tolerates the 6–12 h power gaps if a small equalising tank and aeration buffer are retained, and produces a TSS < 5 mg/L effluent ideal for downstream oxidation. The alternative, UASB + SBR, has lower operating cost and lower power draw, but demands continuous power, skilled operators, and a much larger civil footprint — usually disqualifying it for a Namanve brownfield. MBR MLSS is typically operated at 8,000–12,000 mg/L with HRT 24–48 h; observed yield at 28 °C is 0.15–0.25 kg MLVSS per kg COD removed (HydropureWater field data, 2025-11).
Stage 4 — Advanced oxidation and disinfection. Fenton oxidation (H₂O₂/Fe²⁺ at pH 3, 30–60 min) or ozonation (5–15 mg/L O₃, 20–40 min contact) destroys the residual APIs and ARGs that the biological step cannot mineralise, consistent with Li et al.'s (2024) "composite processes" finding. Polishing with an on-site chlorine dioxide generator at 0.8–1.5 mg/L ClO₂ and 30–60 min contact delivers pathogen and ARG control while meeting NEMA residual chlorine 0.1–0.5 mg/L. ClO₂ outperforms sodium hypochlorite on ARGs and does not form trihalomethanes at the dosing required.
Equipment and Process Comparison for Ugandan Pharma Plants
Procurement teams in Kampala typically need to choose between three biological platforms and three polishing chemistries under the same tight CAPEX envelope. The table below distils the engineering trade-offs against typical 50–500 m³/day flows seen in Namanve and Luzira.
| Unit operation | Footprint (relative) | Power (kWh/m³) | Operator skill | CAPEX share (50–500 m³/d) | 2026 fit for Uganda |
|---|---|---|---|---|---|
| MBR (submerged PVDF) | 0.4× CAS | 0.8–1.2 | Moderate | ~40% | Preferred for tight sites, intermittent power |
| SBR (cyclic aerobic) | 0.7× CAS | 0.5–0.8 | High (cycler tuning) | ~30% | Viable with continuous power and skilled staff |
| UASB + polishing | 0.5× CAS | 0.1–0.3 | High (anaerobic biology) | ~25% | Suitable for high-COD API streams, large sites |
| Fenton oxidation | 0.2× biological | 0.05–0.1 | High (H₂O₂ handling) | ~8% | Use for chemical-synthesis effluent |
| Ozonation | 0.15× biological | 0.15–0.25 | Moderate | ~10% | Higher OPEX, lower chemical import |
| ClO₂ disinfection | 0.05× biological | 0.02–0.04 | Low–moderate | ~5% | Preferred for ARG control and residual safety |
DAF outperforms lamella clarifiers on the API-and-surfactant-rich emulsions typical of Ugandan formulation lines; DAF operates at 15–20 m/h surface loading versus 20–40 m/h for lamella, but the lamella advantage collapses when fats, oils, and grease are present because sludge scraping becomes a maintenance burden (HydropureWater commissioning data, 2026-Q1). Photocatalysis, microalgal bioremediation, and UV-FSR cited in the Dawood et al. (2023) review remain at pilot or bench scale and are not specified for Ugandan production plants in 2026.
Meeting NEMA and EAC Discharge Limits in 2026
Discharge to surface water in Uganda is governed by the National Environment (Waste Management) Regulations 2020, which set COD ≤ 100 mg/L, BOD₅ ≤ 30 mg/L, TSS ≤ 30 mg/L, pH 6–9, residual chlorine 0.1–0.5 mg/L, and — for the first time in 2026 practice — explicit monitoring hooks for total nitrogen and antibiotic residues. EAS 12:2023 harmonises with NEMA for cross-border manufacturers supplying Kenya, Rwanda, and Tanzania, so a single compliance envelope covers the East African Community market. Self-monitoring reporting (SMR) obligations under the National Environment Act 2019 require 24-hour flow-weighted composite sampling at a frequency determined by plant capacity, with quarterly submission to the Directorate of Water Resources and the National Drug Authority for active-substance producers. Li et al. (2024) explicitly call for stricter standards on residual pharmaceuticals; Ugandan auditors are increasingly requesting ARG screening as part of routine inspection. Build ARG monitoring into the project laboratory scope, not as a retrofit.
2026 CAPEX and OPEX Bands for a Ugandan Pharma ETP
For a packaged MBR + DAF + ClO₂ train sized 50–500 m³/day, turnkey installed CAPEX in 2026 sits at USD 800–2,500 per m³/day, with the upper end reserved for API-synthesis-strength streams that require Fenton or ozone polishing. OPEX is dominated by power, membrane replacement every 5–7 years, imported PAC and polyacrylamide, and one trained process operator per shift; a defensible band is USD 0.6–1.4 per m³ treated.
| Cost line | 50 m³/day | 200 m³/day | 500 m³/day | Driver |
|---|---|---|---|---|
| CAPEX (USD/m³/day) | 1,800–2,500 | 1,100–1,600 | 800–1,200 | Civil works share drops with scale |
| Power (kWh/m³) | 1.4–1.8 | 1.0–1.3 | 0.8–1.1 | MBR aeration dominates |
| Membrane replacement (USD/m³) | 0.15–0.25 | 0.10–0.18 | 0.08–0.14 | 5–7 year cycle, PVDF |
| Chemicals (USD/m³) | 0.20–0.35 | 0.15–0.25 | 0.12–0.20 | PAC, polyacrylamide, ClO₂ precursor |
| Labour (USD/m³) | 0.30–0.45 | 0.12–0.20 | 0.06–0.12 | Dilutes with flow |
Modular containerised MBR and skid-mounted ClO₂ systems reduce civil works on brownfield Ugandan sites by an estimated 20–35% (HydropureWater project data, 2026). On-site ClO₂ generation also removes the HTH-bleach import dependency and aligns with WHO Drinking Water Guidelines on residual control, which simplifies SMR documentation. Pair the train with a PLC-controlled chemical dosing skid to keep PAC, polyacrylamide, and pH-correction reagent doses inside the tight band the biological stage requires.
Frequently Asked Questions
What effluent limits apply to pharmaceutical discharge in Uganda under NEMA 2020?
The National Environment (Waste Management) Regulations 2020 set COD ≤ 100 mg/L, BOD₅ ≤ 30 mg/L, TSS ≤ 30 mg/L, pH 6–9, and residual chlorine 0.1–0.5 mg/L for surface-water discharge, with antibiotic-residue and ARG monitoring expected in 2026 audit practice. EAS 12:2023 harmonises these limits for East African Community trade.
Which biological treatment works best for a Ugandan pharma plant with intermittent power?
A submerged MBR with PVDF flat-sheet membranes is the most robust option for plants facing 6–12 hour grid outages, because the biomass is retained on the membranes rather than washed out during flow interruptions and a small equalising tank buffers aeration gaps. UASB + SBR has lower power draw but needs continuous supply and skilled anaerobic-biology operators.
Why specify chlorine dioxide instead of sodium hypochlorite for a pharma ETP in Uganda?
On-site generated ClO₂ controls antibiotic resistance genes more effectively than HTH bleach at the residual band NEMA allows, avoids trihalomethane formation, and eliminates the imported-bleach supply chain risk that routinely delays Ugandan operations. A 0.8–1.5 mg/L ClO₂ dose with 30–60 minute contact reliably meets residual and pathogen limits.
What CAPEX should a procurement team budget for a 200 m³/day pharma ETP in Uganda in 2026?
Budget USD 1,100–1,600 per m³/day installed for a packaged MBR + DAF + ClO₂ train, equivalent to USD 220,000–320,000 turnkey, with OPEX around USD 0.6–1.4 per m³ treated. The upper end covers API-synthesis-strength effluent that requires Fenton or ozone polishing ahead of disinfection.
Related Equipment
- PVDF flat sheet MBR membrane module — specifications, capacity range, and technical data