The Regulatory Contract a Jacksonville Refinery Signs Before the Sewer
Petroleum plants near Jacksonville meet sewer-discharge pretreatment limits by treating 40 CFR Part 403 (general pass-through and interference prohibitions) and 40 CFR Part 419 (refinery categorical standards) as the floor, then clearing the stricter local limits the Jacksonville-area POTW sets on its Significant Industrial User permit. The working train is API/CPI gravity separation → dissolved air flotation (DAF) → equalization/neutralization → MBBR or MBR biological polishing → multimedia filter with online oil-in-water monitoring, typically targeting 50–100 mg/L O&G, 1–10 mg/L sulfides, and 0.5–5 mg/L phenols at the manhole.
Two definitions anchor the federal side. Pass-through, per 40 CFR Part 403.3(p), is a discharge that exits the POTW into waters of the U.S. and, alone or in conjunction with other sources, is a cause of a violation of the POTW's NPDES permit — including an increase in the magnitude or duration of any existing violation (per EPA pretreatment standards guidance, 2025-08). Interference, per 40 CFR Part 403.3(k), is a discharge that alone or with other sources both (1) inhibits or disrupts the POTW, its treatment processes, or its sludge use and disposal, and (2) is a cause of an NPDES violation or a violation of sewage-sludge use or disposal under CWA §405 or RCRA. The legal pivot is the receiving plant's effluent quality and biosolids, not what the refinery thinks it is sending down the sewer.
Under 40 CFR Part 403.5(a), the general prohibition applies whether or not the POTW has issued a control mechanism and whether or not the IU has been issued a permit — there is no silent exemption for an unpermitted discharger. On top of this floor sit the petroleum refining categorical standards at 40 CFR Part 419, which set technology-based effluent limits for refinery process wastewater. Local limits, set through the POTW's Technically Based Local Limits (TBLL) using EPA's Maximum Allowable Headworks Loading (MAHL) method, are routinely more stringent because the control authority must protect its own NPDES permit and its Part 503 biosolids program. The northeast-Florida receiving water — the St. Johns River system — pushes conservative local limits on ammonia, metals, and BTEX in addition to the federal categorical numbers, and that conservatism is what shapes the Jacksonville SIU permit in 2026 (per 40 CFR Part 403.5(c) local-limits framework).
What Streams Hit the Sewer at a Jacksonville Refinery or Bulk Plant
A refinery's pollutant mix is the sum of the streams it seweres together. The standard inventory runs: desalter brine carrying emulsified oil, salts, and trace metals; spent caustic carrying sulfides and phenols at high pH; sour-water stripper bottoms carrying dissolved H₂S and ammonia; tank draw and loading-rack drip carrying free oil; and oily utility water and ballast water rounding out the rest. Each stream contributes a different parameter envelope, and the operating discipline at the unit — segregated, combined, or batched — decides what the POTW actually sees.
For Jacksonville bulk plants and terminals, the inventory is tighter but no less heterogeneous: tank-bottom water (free oil plus sludge), API/coalescer dumps, truck and rail loading drip, vehicle wash-rack water (emulsified with sub-50 µm droplets once surfactants enter), hydrostatic test water, and product-pad stormwater. The droplet-size distribution is what makes a single-technology approach fail. A coalescer dump is mostly free oil ≥60 µm and needs gravity separation. Wash-rack wastewater is emulsified below 50 µm and needs micro-bubble flotation. Loading-arm drip swings between the two depending on residence time and shear.
Source segregation is the cheapest control available. Segregated laterals for product-handling pads, covered dump valves, and dedicated oil/water sewering on truck loading islands reduce the volume hitting the train by 40–70% in field retrofits (HydropureWater field data, 2025–2026) and convert most of the remaining flow from a "design problem" into a "design choice." A practical worked example of how a DAF handles a coalescer-dump slug is covered in the how a DAF machine works — engineering and selection guide.
The Five-Stage Treatment Train Between the Process Sewer and the Manhole
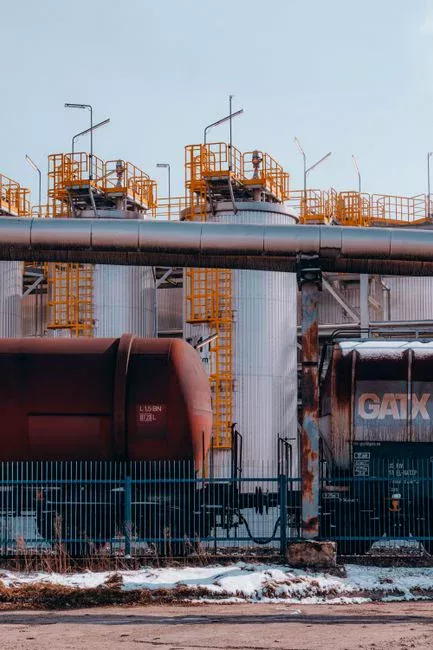
US refiners run a five-stage train between the process sewer and the POTW's manhole; the equipment varies by site but the unit operations and their order are remarkably consistent. Each stage is sized to remove the fraction the next stage cannot, and each maps to either a pass-through risk (oil, TSS, BTEX, ammonia) or an interference risk (sulfides, phenols, pH swings, slug flows) defined in 40 CFR Part 403.
Stage 1 — API separator or corrugated-plate interceptor (CPI). Free oil is removed by gravity because it is the cheapest and most forgiving operation; everything downstream (pumps, membranes, sensors) suffers if free oil is not taken out first. A well-operated API separator typically leaves 100–200 mg/L O&G in the water phase; a CPI hits a similar band in a much smaller footprint with 1–2 inch plate spacing at roughly 45° corrugation. This stage sets the floor for emulsified-oil load on Stage 2.
Stage 2 — DAF or induced gas flotation (IGF). Micro-bubble flotation strips the emulsified oil, FOG, and colloidal TSS that the API unit cannot catch, and brings oil & grease down to roughly 15–30 mg/L. Operating air-to-solids ratios sit in the 0.02–0.06 range, hydraulic retention is 15–30 minutes, and saturator recycle rates run 20–50% of forward flow. A refinery-scale unit in this duty is typically specified in the 4–300 m³/h capacity range, with skid-mounting for tie-in during scheduled turnarounds; the dissolved air flotation (DAF) system covers that envelope. The outlet of this stage has to clear the 50–100 mg/L POTW oil & grease ceiling on its own, with margin, before any biological polishing is asked to clean up oil.
Stage 3 — Equalization and neutralization. Flow and pH swings from spent-caustic pushes, desalter upsets, and tank transitions are smoothed in an EQ basin sized for 8–24 hours of hydraulic retention, and pH is adjusted to 6–9 before the biological stage. This is the single most important control point for preventing interference events; a slug of high-pH, high-sulfide spent caustic is the textbook case of a discharge that would inhibit the POTW's biomass and trigger a violation downstream. Chemistry is closed-loop here, with pH trim and coagulant or demulsifier feed handled by an HydropureWater automatic chemical dosing system at 50–200 mg/L ahead of the DAF to unlock residual <50 mg/L HEM.
Stage 4 — Biological polishing. An MBBR or MBR reduces phenols, sulfides, benzene, and ammonia-nitrogen. MBBRs tolerate the 200–800 mg/L COD that survives the front of the train and are robust to load swings; MBRs add a <1 µm flat-sheet PVDF membrane barrier that holds MLSS at 8,000–12,000 mg/L and produces <5 mg/L TSS and <1 NTU turbidity, in roughly 60% of the footprint an equivalent CAS basin would need — which is why MBR is the default for space-constrained refinery retrofits. The DF series MBR flat-sheet membrane module is sized for this biological polishing role. The MBR here is containment of biomass and solids, not a free-standing removal claim.
Stage 5 — Polishing and monitoring. A multimedia filter catches any TSS breakthrough, an online fluorescence oil-in-water analyzer alarms on a 10–20 mg/L setpoint, and pH/conductivity probes feed the control room. Every stage in this train maps to either a pass-through or interference risk in 40 CFR Part 403.
| Stage | Unit Operation | Design Parameters | Typical Effluent O&G | Maps to 40 CFR Part 403 Risk |
|---|---|---|---|---|
| 1 | API separator or CPI | HRT ≥30 min at peak flow; plate spacing 1–2 in, ~45° | 100–200 mg/L | Pass-through (free oil) |
| 2 | DAF / IGF | ASR 0.02–0.06; HRT 15–30 min; recycle 20–50%; 4–300 m³/h | 15–30 mg/L | Pass-through (emulsified oil, TSS) |
| 3 | Equalization + neutralization | HRT 8–24 h; pH 6–9; chemistry feed 50–200 mg/L | pH-controlled, damped slug profile | Interference (pH, sulfide slug) |
| 4 | MBBR or MBR (PVDF <1 µm) | MLSS 8,000–12,000 mg/L (MBR); 200–800 mg/L COD tolerance (MBBR) | <5 mg/L TSS; <1 NTU (MBR) | Pass-through (phenols, NH₃, BTEX) |
| 5 | Multimedia filter + online OIW analyzer | OIW alarm 10–20 mg/L; pH/cond probes | Final compliance point | Continuous pass-through verification |
Parameter Map: Influent vs. Local Limit vs. Removal Stage
The table below maps the refinery-side pollutant to a typical inlet range, a typical Jacksonville-area POTW local limit, the stage that does the primary removal, and the polishing step that protects the permit. The numbers describe the engineering bands seen in practice; the specific number in any given permit is set by the local control authority and can be more stringent than 40 CFR Part 403 alone. The O&G row is anchored at 50–100 mg/L for the POTW ceiling versus 15–30 mg/L for the DAF effluent, so the engineer can see the safety margin the DAF has to deliver alone before biology is asked to contribute. Hexane Extractable Material (HEM) under EPA Method 1664A, defined in 40 CFR § 401.16, is the federally used surrogate for O&G; most Jacksonville permits in 2026 sit at 100–200 mg/L HEM daily max with approximately 250 mg/L TSS (per the 2020 St. Joseph, MO TBLL evaluation by Black & Veatch, 2020-12).
| Parameter | Typical Refinery Influent | Jacksonville-Area POTW Local Limit (typical) | Primary Removal Stage | Polishing / Containment Step |
|---|---|---|---|---|
| O&G (HEM, EPA 1664A) | 500–5,000 mg/L free + emulsified | 50–100 mg/L (some water-reuse basins 100–200 mg/L daily max) | API/CPI → DAF (15–30 mg/L) | Multimedia filter; online oil-in-water analyzer |
| TSS | 200–1,500 mg/L | ~250 mg/L daily max | DAF (colloidal) + biological | MBR (PVDF <1 µm) or multimedia filter |
| Sulfides (dissolved/total) | 5–50 mg/L (spikes from spent caustic) | 1–10 mg/L | Equalization + biological (sulfide oxidation) | MBBR/MBR polishing; online S²⁻ probe |
| Phenols | 5–50 mg/L | 0.5–5 mg/L | Biological oxidation (MBBR/MBR) | GAC or advanced oxidation if required |
| Benzene / TPH | 0.1–10 mg/L | 0.1–1 mg/L (often GC/MS quarterly) | Air stripping / biological oxidation | GAC polishing; quarterly compliance sampling |
| Ammonia-N | 10–100 mg/L | 10–20 mg/L (varies with receiving water) | MBBR/MBR nitrification | MBR flat-sheet modules; online NH₃ probe |
| pH | 5–12 (slugs from spent caustic) | 6–9 | Equalization + neutralization | Online pH trim with interlock to sewer shutoff |
| Hexavalent chromium | 0.05–1 mg/L (cooling-tower blowdown) | 0.5 mg/L or per categorical standard | Reduction to Cr(III) + precipitation | Sand/multimedia filter; quarterly metals sampling |
| COD | 500–3,000 mg/L | Surcharge band at 500 mg/L (per 40 CFR Part 403 high-strength surcharge framework) | Equalization + biological (MBBR/MBR) | MBR flat-sheet barrier; online COD probe |
The Documentation Side: How a Jacksonville Refinery Defends a No-Pass-Through Claim
The treatment train is the engineering side; the documentation side is where most EPA and state enforcement actions actually land. A refinery's pass-through/interference defense runs through five repeatable steps.
Step 1 — Get classified as a Significant Industrial User (SIU) and obtain a control mechanism. The control mechanism lists the local numerical limits, the monitoring schedule, and the reporting cadence the refinery will be judged against. Until that document is in hand, the refinery is still on the hook under 40 CFR Part 403.5(a), but without a defined sampling schedule (per EPA pretreatment standards and local-limits framework, 2025-08).
Step 2 — Self-monitoring with 24-hour flow-weighted composite sampling. Monthly for O&G (HEM by EPA Method 1664A), TSS, sulfides, phenols, and ammonia; quarterly for metals, BTEX, and hexavalent chromium. Results are reported on a Discharge Monitoring Report (DMR) or its local equivalent, and exceedances trigger accelerated monitoring.
Step 3 — Slug-control plan under 40 CFR Part 403.8(b)(4). EPA enforcement actions repeatedly target the slug-control plan. The plan must be written, current, and trained out, covering loading racks, tank transitions, and batch discharges; it must define what counts as a slug, what the refinery will do to contain it, and how it will notify the POTW. As a rule of thumb, any discharge that could cause interference must be reported within 24 hours.
Step 4 — Accidental-discharge reporting. When a slug escapes — a spent-caustic overflow, a desalter upset, a tank-bottom-water release — the refinery must notify the POTW and the relevant hazardous-waste authorities within the EPA-prescribed window and follow up with a written report describing the cause, the corrective action, and the revised prevention measures. Slug plans that exist on paper but were not followed are the most common root cause in consent decrees.
Step 5 — Maintain auditable records. BMPs, restricted-chemical inventory (the SIU permit lists restricted chemicals), operator training, chain of custody for every composite sample, and calibration logs for the online analyzers. These are the items an EPA or state inspector will request first. The paper trail is what turns a "no pass-through" claim into a defensible one. The 2024–2026 National Pretreatment Program review cycle has tightened the audit posture, and the operator-side checklist for that audit mirrors the documentation steps above (per the 2024–2026 NPP review). Operators building a 2026 maintenance file around the same items will find cross-coverage in the petrochemical wastewater plant maintenance field guide.
SNC Math and the 30/60-Day Cure Window in 2026
The EPA National Pretreatment Program triggers Significant Noncompliance (SNC) on any of three conditions: a numerical limit exceeded by ≥1.5× on any single day, a numerical limit exceeded on more than 5% of measurement days in a six-month period, or a required report more than 30 days late. The consequence chain is linear: one late report triggers a Notice of Violation; two in twelve months escalate to SNC; SNC triggers a Show Cause hearing, surcharges, possible permit termination, or mandated zero-discharge status (per the EPA National Pretreatment Program, 2025).
Translate that into an equipment-selector constraint. A refinery that runs the BMP list, files on the 15th of every month, and keeps a pre-audit file against the EPA National Pretreatment Program audit checklist categories will not see an SNC finding in 2026. Where a facility already has a problem, the cure window is 30 days from NOV to corrective action and 60 days to demonstrated compliance — and the only way to compress that window reliably is to have the right unit operations sized with margin, not to negotiate with the inspector. A side-by-side on a comparable west-coast refinery pretreatment scope is in the petroleum pretreatment guide for Carson, CA refiners.
Frequently Asked Questions
What is the typical O&G local limit at a Jacksonville-area POTW in 2026?
Most 2026 permits set HEM (oil and grease) at 100–200 mg/L daily maximum and approximately 250 mg/L TSS, derived using EPA's MAHL method under 40 CFR Part 403 (per the 2020 St. Joseph, MO TBLL evaluation by Black & Veatch, 2020-12). Stricter POTWs in water-reuse basins push daily maximum HEM toward 50 mg/L.
Is a DAF alone enough to meet the HEM limit?
No, in most cases. Free oil from coalescer dumps and tank drops blankets DAF micro-bubbles and crashes the air-to-solids ratio; a DAF alone fails under slug loads (HydropureWater field data, 2026). A CPI or API primary stage ahead of the DAF is standard practice, with the DAF sized for 15–30 mg/L O&G and a 20–30% safety margin on ASR.
What does an MBR flat-sheet membrane add versus an MBBR?
An MBR adds a <1 µm PVDF flat-sheet membrane barrier that holds MLSS at 8,000–12,000 mg/L and produces <5 mg/L TSS and <1 NTU turbidity, in roughly 60% of the footprint of an equivalent CAS basin. The role of the MBR at this train position is containment of biomass and solids; it is not a free-standing biological removal claim.
What triggers Significant Noncompliance (SNC) under EPA's National Pretreatment Program?
SNC is triggered by any of: violation of a numerical limit by ≥1.5× for any single day; violation of a numerical limit for more than 5% of measurement days in a six-month period; or failure to provide required reports within 30 days of the due date. SNC can lead to enforcement action, surcharges, or permit termination (per the EPA National Pretreatment Program, 2025).
Which EPA analytical method is used for O&G in sewer-discharge permits?
EPA Method 1664A, which uses n-hexane extraction and is reported as Hexane Extractable Material (HEM). HEM is the federally used surrogate for fats, oils, and grease under 40 CFR § 401.16 and is the parameter most U.S. POTW permits cite as "O&G" (per St. Joseph, 2020 TBLL).