
Why Bakery Wastewater Sludge Is a Distinct Engineering Challenge
Bakery effluent typically arrives at the treatment plant with COD between 5,000 and 25,000 mg/L, BOD5 in a similar 4,000–18,000 mg/L band, free-floating oils from dough and pan washes, and sucrose/glucose spikes from clean-in-place rinses that swing pH from roughly 3 (acid CIP) to 11 (caustic CIP) within a single shift. That feed profile produces an activated sludge that is high-yield, low-density, and oil-coated — flocs carry emulsified FOG into the clarifier, ride to the surface, and then blind the filter cloth when the underflow sludge is dewatered. Conventional activated-sludge operations on these streams run mixed-liquor suspended solids (MLSS) of 4,000–8,000 mg/L with a yield coefficient around 0.3–0.6 kg DS per kg COD removed, which is heavier than municipal sludge but the solids are far less compressible.
The closest peer benchmark is the 2024 vermicelli wastewater study (S4, Scientifica), which reported a raw BOD5/COD of 0.52 — low enough to signal a high fraction of recalcitrant or sugar-bound organics — and TDS interference that dragged the downstream aerobic stage to only 83% COD and 87.33% BOD5 removal. That same recalcitrance shows up in bakery plants: dissolved starches and shortening create a colloidal matrix that resists both biodegradation and mechanical dewatering, so the sludge volume problem compounds as biology underperforms and operators over-aerate to compensate.
The Full Process Train: From Effluent to Dewatered Cake
A bakery plant handling its own wastewater and biosolids needs a seven-step train sized to the peak shift load, not the daily average. Each step targets a specific failure mode downstream.
- Screening and grit removal. A rotary bar screen with 3–6 mm aperture strips packaging fibrous debris (cardboard, paper, plastic film) before it reaches the lift pumps. A small grit chamber downstream protects the DAF and biological reactors from abrasion.
- DAF for FOG and suspended solids. Hydraulic loading 4–25 m³/h per m², micro-bubble size 25–50 μm. Expect 70–90% FOG removal and 60–85% TSS removal on bakery streams — the single biggest volume reduction point in the plant.
- Equalization. 8–24 h HRT with mechanical mixing and aeration to dampen pH and load swings; pH correction to 6.5–7.5 ahead of the biological stage.
- Fenton pre-treatment (when influent BOD5/COD < 0.4). H2O2/Fe²⁺ dosing window 0.5–2.0 g H2O2 per g COD at pH 3 for 30–60 min. This is the S4 trick that lifted the BOD5/COD from 0.52 to 0.63 and made the downstream aerobic stage viable.
- Biological stage. Anoxic/aerobic A/O or integrated MBR membrane bioreactor. Operating envelope from S4: pH 6.5–8.5, DO ≥3 mg/L, HRT 14 h, settling 2 h; expected removal 83% COD and 87.33% BOD5.
- Sludge thickening. Gravity belt thickener or DAF thickener to 3–5% DS before digestion or dewatering.
- Sludge dewatering. Plate-and-frame filter press to 22–35% cake solids, the industrial benchmark for food-processing biosolids.
Pre-treatment chemistry is where the process either pays back or bleeds money. A PLC-controlled chemical dosing skid feeding Fenton reagents, coagulant, and cationic polymer keeps the operating window inside the ranges below without operator intervention.
| Unit Operation | Key Parameter | Operating Range | Source |
|---|---|---|---|
| Screening | Aperture | 3–6 mm | Engineering practice |
| DAF | Hydraulic loading | 4–25 m³/h per m² | Food-processing benchmark |
| DAF | Micro-bubble size | 25–50 μm | Food-processing benchmark |
| DAF | FOG removal | 70–90% | Food-processing benchmark |
| DAF | TSS removal | 60–85% | Food-processing benchmark |
| Equalization | HRT | 8–24 h | Engineering practice |
| Fenton | H2O2/Fe²⁺ dose | 0.5–2.0 g H2O2/g COD | S4 (2024) |
| Fenton | Reaction pH | 3.0 | S4 (2024) |
| Fenton | Contact time | 30–60 min | S4 (2024) |
| Aerobic / MBR | pH | 6.5–8.5 | S4 (2024) |
| Aerobic / MBR | DO | ≥3 mg/L | S4 (2024) |
| Aerobic / MBR | HRT | 14 h | S4 (2024) |
| Aerobic / MBR | COD removal | 83% | S4 (2024) |
| Aerobic / MBR | BOD5 removal | 87.33% | S4 (2024) |
| Thickener | Outlet DS | 3–5% | Engineering practice |
| Filter press | Cake solids | 22–35% | Industrial benchmark |
Biological Treatment Options: Conventional Activated Sludge vs. MBR
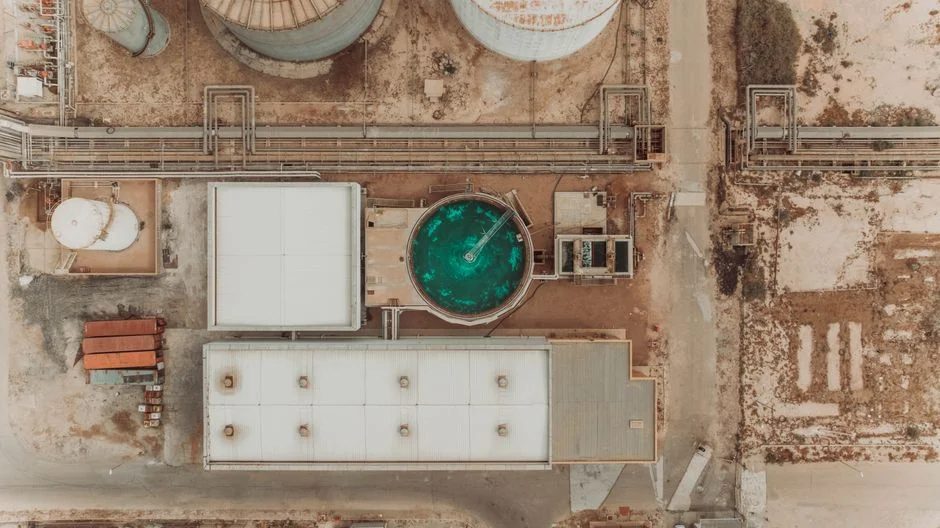
The choice between conventional activated sludge (CAS) and a membrane bioreactor (MBR) for a bakery plant is fundamentally a footprint-versus-capex decision that cascades downstream into sludge handling. CAS runs at MLSS 3,000–5,000 mg/L with a sludge yield around 0.4 kg DS per kg COD removed, occupies more tankage, and discharges a supernatant that typically needs a sand filter or cloth media polish before sewer discharge. MBR runs at MLSS 8,000–12,000 mg/L — about 2–2.5× the biomass concentration — which shrinks the aeration tank footprint by roughly 60% and produces an effluent consistently below 1 NTU turbidity at <1 μm, suitable for non-contact reuse (cooling-tower makeup, landscape irrigation, CIP final rinse) under most jurisdictions.
The trade-off appears in the sludge line. Higher MLSS in an MBR means more total solids per cubic meter treated, but the sludge is denser, stickier, and demands more polymer at the dewatering press — typical cationic polyacrylamide dose climbs from 6–8 g/kg DS on CAS sludge to 10–14 g/kg DS on MBR sludge. The decision rule: specify MBR for greenfield plants with a water-reuse target or a tight effluent consent (COD <50 mg/L); specify CAS plus a high-efficiency sedimentation tank for retrofits with a sewer-discharge permit. Both options still need sludge thickening and dewatering downstream — biology alone does not solve the solids problem.
| Parameter | Conventional Activated Sludge | MBR |
|---|---|---|
| MLSS | 3,000–5,000 mg/L | 8,000–12,000 mg/L |
| Sludge yield | ~0.4 kg DS/kg COD | 0.25–0.35 kg DS/kg COD |
| Footprint | Larger (reference) | ~40% of CAS |
| Effluent turbidity | 5–30 NTU (post-sand filter) | <1 NTU |
| Reuse potential | Limited | Non-contact reuse (cooling, irrigation) |
| Capex | Lower | ~30–50% higher |
| Polymer demand at dewatering | 6–8 g/kg DS | 10–14 g/kg DS |
| Best fit | Retrofit, sewer discharge | Greenfield, reuse consent |
Co-Digestion: Why Mixing Bakery Sludge with Food Waste Boosts Biogas and Kills Pathogens
Anaerobic co-digestion is where bakery sludge stops being a cost line and starts being a feedstock. The C:N balance matters more than the absolute organic load: bakery secondary sludge typically runs C:N 20–40, while source-separated food waste sits at C:N 10–20; blending to a digester C:N of 25–30 maximizes methanogen activity and avoids ammonia inhibition above roughly 4,000 mg/L NH3-N. Mesophilic operation at 35–37 °C with HRT 20–30 days and an organic loading rate of 2–4 kg VS/m³·day delivers a methane yield in the range of 0.3–0.5 m³ CH4 per kg VS added — enough to fire a combined heat and power (CHP) unit sized to the plant's baseload steam demand.
The 2025 study in Environmental Monitoring and Assessment (S1) is the key data point for procurement justification: 21-day mesophilic co-digestion of secondary sludge with food, bakery, and flower waste achieved up to 100% removal of Salmonella spp. and E. coli, with parallel reductions in antibiotic-resistance genes. That pathogen kill is not academic — it is the line item that converts a "Class B" cake into a land-applicable product and removes a regulatory ceiling on the disposal route. Pair the digester with a UASB reactor operating cost analysis for the upstream high-strength stream if the plant's BOD5 exceeds 5,000 mg/L on a sustained basis.
Sludge Dewatering: Choosing Between Filter Press, Centrifuge, and Belt Press
Dewatering tech selection is a three-way trade between cake solids, footprint, and continuous-versus-batch operation. Bakery sludge is oilier and more compressible than municipal biosolids, so the cake-solids ceiling on any technology runs 2–4 percentage points lower than a municipal benchmark — adjust expectations accordingly.
- Plate-and-frame filter press. 22–35% cake solids, batch operation, polymer demand 5–15 kg/t DS, medium capex, medium labor. Best for plants targeting maximum volume reduction (75–80% volume cut versus liquid sludge) with a defined cake end-point — incineration, landfill, or co-pyrolysis feed.
- Decanter centrifuge. 18–28% cake solids, continuous, polymer demand 3–8 kg/t DS, small footprint, higher capex. Best for high-throughput plants with biogas or land-application outlets where continuous operation outweighs the last few points of cake dryness.
- Gravity belt thickener + belt press. 18–22% cake solids, continuous, polymer demand 6–12 kg/t DS, lowest capex. Best for small plants with sewer disposal of the dewatered liquor and no need for cake handling.
For bakery sludge specifically, two conditioning notes: dose cationic polyacrylamide at 8–12 g/kg DS (higher than the municipal norm because emulsified FOG consumes charge), and consider pre-coating the feed with diatomaceous earth at 50–100 g/kg DS when FOG blinding persists after polymer tuning alone. The plate-and-frame filter press remains the workhorse for plants that want the driest cake; pair it with a properly sized inclined plate settler upstream if the WAS is carrying too many fine solids for the press to handle efficiently.
| Technology | Cake Solids | Operation | Polymer Demand | Capex | Best Fit |
|---|---|---|---|---|---|
| Plate-and-frame filter press | 22–35% | Batch | 5–15 kg/t DS | Medium | Incineration, landfill, co-pyrolysis feed |
| Decanter centrifuge | 18–28% | Continuous | 3–8 kg/t DS | High | Biogas, land application, high throughput |
| Belt press (with GBT) | 18–22% | Continuous | 6–12 kg/t DS | Low | Small plant, sewer liquor disposal |
End-of-Pipe Options: Landfill, Incineration, Biogas, and Biochar Recovery
Landfill remains the default endpoint for most bakery biosolids, but tipping fees have climbed and biosolids restrictions are tightening under most municipal pretreatment programs. Anaerobic digestion with combined heat and power (CHP) at 35–40% electrical efficiency offsets plant steam demand and typically pays back in 4–7 years for 50–100 m³/d plants — the strongest ROI case when the host plant has a baseload steam or hot-water draw. Incineration only pencils out at large scale or when co-firing is available in an existing boiler; standalone sludge incinerators rarely make sense below 50 t DS/d.
The emerging value-add pathway is co-pyrolysis. The 2025 ACS Omega study (S2) showed that copyrolysis of municipal sewage sludge with wheat straw and bakery waste husks at 500–900 °C improved the biochar nutrient profile (K-rich from the husks) and immobilized heavy metals, producing a soil-conditioner-grade product. For a bakery plant, this is a closed-loop play: the dewatered cake plus a fraction of the inedible bakery husks becomes the feed, and the biochar is sold or applied to land under a beneficial-use permit. The pre-treatment chemistry that makes the cake dewater well — Fenton conditioning, polymer dose — does not interfere with downstream pyrolysis, but a dryer cake (≥28% DS) is preferred to keep the feed moisture below the 15–20% threshold most pyrolyser designs assume.
Frequently Asked Questions
What is the typical COD and BOD5 of bakery wastewater?
Bakery effluent COD typically runs 5,000–25,000 mg/L with BOD5 in the 4,000–18,000 mg/L band; the BOD5/COD ratio is often 0.5–0.7 in raw streams but drops to 0.52 in high-starch, high-TDS variants analogous to the vermicelli wastewater benchmark (S4, Scientifica 2024).
Is an MBR alone enough to meet discharge limits for a bakery plant?
MBR alone reaches <1 NTU turbidity and typically 90–95% COD removal, which satisfies non-contact reuse and most indirect-discharge consents; for direct sewer discharge under tight COD consents (<50 mg/L), it is usually sufficient, but high-TDS bakery streams may need the upstream Fenton step (0.5–2.0 g H2O2/g COD at pH 3 for 30–60 min) to lift the BOD5/COD above 0.5 and unlock full biodegradation (per S4).
What cake solids can a plate-and-frame filter press achieve on bakery sludge?
Industrial benchmark for bakery and food-processing biosolids is 22–35% dry solids, depending on oil content, polymer conditioning (cationic polyacrylamide 8–12 g/kg DS), and feed solids; expect the low end of that range on raw WAS and the high end after a digester or pre-coat with diatomaceous earth.
Is bakery sludge classified as hazardous waste?
No — bakery biosolids are generally non-hazardous industrial waste, though they may be subject to local FOG and biosolids disposal rules; co-digestion with food waste at mesophilic conditions for 21 days can achieve up to 100% removal of Salmonella spp. and E. coli (S1, Environ Monit Assess 2025), shifting the cake toward land-applicable Class A status.
How long does anaerobic co-digestion take to reduce pathogens in bakery sludge?
Mesophilic co-digestion at 35–37 °C with HRT 20–30 days achieved complete (up to 100%) removal of Salmonella spp. and E. coli in 21 days when secondary sludge was blended with food, bakery, and flower waste (S1, Environ Monit Assess 2025); thermophilic operation at 50–55 °C cuts HRT to 10–15 days for the same kill.
Related Equipment
- Dissolved air flotation system — specifications, capacity range, and technical data