
Why Stamping Press Oily Water Breaks Generic MBR Sizing
Stamping press wastewater is not a single "oily" stream — it is a mixture of four contaminant classes that each stress a membrane bioreactor (MBR) system differently. Treating it as generic oily water is the most common basis-of-design error on stamping plant projects, and it shows up as a fouled membrane tank within 1–3 months of startup. Capodici et al. (MDPI Water, 2017) confirm that high concentrations of a separate oily phase disrupt biological treatment kinetics and require proper upstream oil removal before the MBR can run at design flux.
The four streams are: (1) tramp and hydraulic oil, present as both free oil (floating) and emulsified oil (50–500 mg/L) stabilized by surfactants in drawing compounds; (2) drawing and stamping compounds — fatty acids, synthetic esters, or polymer-rich lubes that bring COD 5,000–15,000 mg/L in the raw stream; (3) phosphate- or borate-based alkaline cleaners with pH 9–11, which add nutrient load and foul membranes with calcium phosphate scale; (4) metal fines (Fe, Al, Zn at 20–200 mg/L) that abrade flat-sheet surfaces and accumulate in mixed liquor.
Emulsified oil is the real threat to MBR sizing. Free oil is removed by a simple plate separator; emulsified oil (typically 50–500 mg/L after a DAF or separator) is surfactant-stabilized as 1–20 µm droplets that pass through oil/water separators and blind 0.1 µm PVDF membranes within 60–90 days if it reaches the membrane tank untreated. Synthetic vs mineral oil also changes biology: ester-based drawing compounds biodegrade 40–60% faster than petroleum oils (per Capodici et al., 2017), but generate sharper BOD spikes that destabilize F/M ratio on batch press cycles. Generic oily-water MBR sizing factors from petrochemical references do not transfer.
Step 1 — Characterize the Inlet Flow and Load
No MBR sizing number is defensible without a composite sample across a full production shift. Run a refrigerated autosampler on the press shop sump outlet for 8 h minimum, with 1 L every 15–30 min composited into a single daily sample; one grab is not data. Sample on at least three different production days to catch compound-changeover events.
Typical stamping press oily water envelope at the EQ tank inlet:
| Parameter | Typical range | Why it matters for MBR sizing |
|---|---|---|
| Flow per line | 5–50 m³/day | Sets Q for every downstream calculation |
| COD | 800–5,000 mg/L | Drives aeration tank volume and air demand |
| BOD₅ | 300–2,000 mg/L | Defines F/M ratio and SRT |
| Total oil (free + emulsified) | 100–2,000 mg/L | Sets DAF preload, membrane fouling risk |
| TSS | 200–1,500 mg/L | Drives sludge yield and waste-rate |
| pH | 7–10 (cleaners push 10–11) | Pre-acidify before bio tank to 6.5–8.0 |
| Temperature | 25–45 °C (coolant cross-contamination) | Affects viscosity, oxygen transfer, kinetics |
| Peak/avg flow ratio | 2:1 to 4:1 (batch presses) | Drives equalization volume |
Document temperature separately — hot coolant cross-contamination (35–45 °C) lowers oxygen saturation from 9.1 mg/L to 6.5 mg/L at 40 °C, which raises real aeration demand by 25–35% versus a 25 °C design basis (standard alpha-factor correction). Peak-to-average flow ratio is the single most under-measured parameter; an undersized equalization tank is the most common field retrofit.
Step 2 — Set Discharge or Reuse Targets Before Sizing
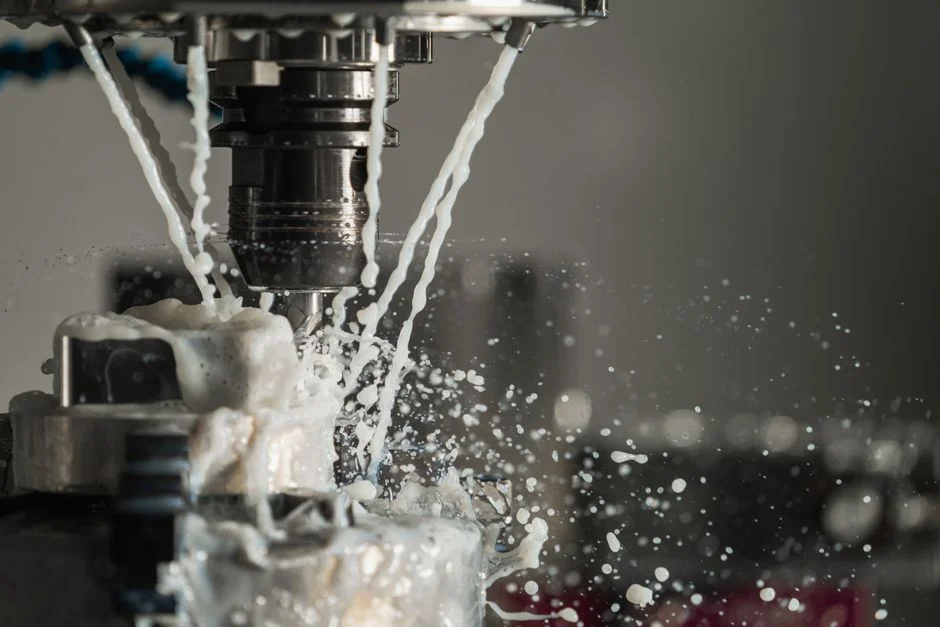
The MBR is sized backwards from the effluent number, not forwards from the inlet. Pick the binding compliance regime first; mixing US and Chinese limits is a frequent vendor-quote error.
| Regime | COD limit | Oil & grease limit | Source |
|---|---|---|---|
| China — surface water discharge (一级A) | ≤ 50 mg/L | ≤ 5 mg/L | GB/T 31962-2015 |
| China — sewer discharge to municipal WWTP | ≤ 500 mg/L | ≤ 20 mg/L | GB 8978-1996 |
| US — metal finishing point source | Monthly avg 26 mg/L oil & grease | 26 mg/L O&G | EPA 40 CFR 433 |
| EU — surface treatment BAT-AEL | 30–200 mg/L (site-specific) | Site-specific | IED Directive 2010/75/EU, BAT conclusions 2024 |
| Reuse — cooling tower make-up | ≤ 50 mg/L | ≤ 2 mg/L | Industry practice (heat-exchanger fouling) |
| Reuse — wash water (closed loop) | ≤ 50 mg/L | ≤ 2 mg/L | Industry practice |
Designing to "as low as possible" wastes membrane area and blower power; designing to sewer-discharge numbers when the plant actually discharges to surface water is a permit violation. Pin the number before any volume calculation.
Step 3 — Size the Equalization Tank
The equalization (EQ) tank exists to convert the press-cycle saw-tooth flow into a steady feed to the biological stage. Without it, F/M swings of 5–10× drive MLSS washout and chronic bulking.
For batch stamping with peak/avg = 3:1, use 16–24 h HRT. The basic EQ volume formula is:
V_EQ = (Q_peak − Q_avg) × t_peak
For a 30 m³/day average with 90 m³/day peak sustained for 4 h: V_EQ = (90 − 30) × 4 = 240 m³. A 240 m³ EQ tank feeds a 75 m³ aeration tank at 8 h HRT — well inside the 12–24 h oily-MBR target.
EQ must include submerged mixing at 4–6 W/m³ to keep fines in suspension and prevent oil re-emulsification at the surface. Add coarse-bubble diffused aeration (0.3–0.5 Nm³/m³·h) for odor control and to strip volatile hydrocarbons. pH adjustment to 6.5–8.0 with online NaOH/H₂SO₄ dosing happens here; phosphate-rich cleaners above 50 mg/L PO₄ should be precipitated with FeCl₃ or alum in the EQ to prevent struvite scaling in the membrane tank.
Step 4 — Size the Aeration Tank (Biological Stage)
The aeration tank is sized by F/M ratio and target MLSS — not by HRT alone. For oily wastewater, design F/M = 0.05–0.15 kg COD/kg MLSS·d, well below the 0.2–0.5 used for municipal MBR, because hydrocarbons inhibit nitrifiers and slow oil-degrader growth kinetics (Capodici et al., MDPI Water 2017). The benefit of slower F/M is a denser, more resilient biomass that retains the slow-growing hydrocarbon-degrading population.
| Parameter | Oily-MBR design range | vs. municipal MBR |
|---|---|---|
| F/M ratio | 0.05–0.15 kg COD/kg MLSS·d | Lower (municipal: 0.2–0.5) |
| MLSS | 6,000–10,000 mg/L | Higher (municipal: 3,000–5,000) |
| HRT (aeration tank) | 12–24 h | Higher |
| SRT | 20–40 days | Higher (retains slow growers) |
| DO setpoint | 2.0–3.0 mg/L | Same |
The aeration tank volume formula:
V_AT = (Q × COD) / (F/M × MLSS)
Worked: Q = 30 m³/d, COD = 2,000 mg/L (= 2 kg/m³), F/M = 0.1, MLSS = 8,000 mg/L (= 8 kg/m³). V_AT = (30 × 2) / (0.1 × 8) = 60 / 0.8 = 75 m³. At 30 m³/d average, that is 75 / 30 = 2.5 d = 60 h HRT — generous, but justified by the inhibitory effect of residual oil on biodegradation kinetics.
Aeration air demand for COD removal is 4–6 Nm³ air per kg COD removed. With 60 kg COD/d in our example, biological air = 240–360 Nm³/d = 10–15 Nm³/h continuous. Add 20% for oxygen-transfer efficiency losses at 35 °C, and the biological blower alone needs ~12–18 Nm³/h.
Step 5 — Size the PVDF Membrane Module
Translate permeate flow into membrane area using net flux as the design variable. For submerged flat-sheet MBR treating oily water, design net flux is 12–18 L/m²·h. The conservative 12 L/m²·h value leaves a 30–40% fouling margin to absorb flux decline between chemical-in-place (CIP) cycles — and on oily feeds, fouling margins are not optional.
Membrane area formula:
A = Q_permeate / (flux × 24)
For Q = 30 m³/d at 12 L/m²·h: A = 30,000 L / (12 × 24) = 30,000 / 288 ≈ 104 m². Standard flat-sheet cassettes ship at 80–225 m² per module; one 225 m² cassette covers this duty with built-in margin, or two 80 m² cassettes for redundancy on a critical production line.
Specify 0.1 µm PVDF flat-sheet modules with an integrated aeration box — 10–20× lower energy than external cross-flow designs. Target transmembrane pressure (TMP) ≤ 0.3 bar; sustained operation above 0.4 bar signals irreversible fouling. CIP every 3–6 months with 1,000–2,000 mg/L NaOCl soak (2 h) followed by 1,000 mg/L citric acid (1 h) recovers 80–95% of clean-water flux (HydropureWater field data, 2025). Confirm the design hits the 60% smaller footprint vs. conventional clarifier-based activated sludge — verified on integrated MBR membrane bioreactor system installations using DF series PVDF flat-sheet membrane modules.
Step 6 — Size the Scouring Aeration and Sludge Handling

Membrane scouring air is non-negotiable on flat-sheet MBR. Without continuous bubble flow across the membrane surface, sludge cake builds within hours and flux collapses. Design at 0.3–0.5 Nm³ air per m³ permeate, supplied through coarse-bubble diffusers directly beneath the cassette.
For 30 m³/d permeate, scouring air = 0.4 × 30 = 12 Nm³/h continuous, i.e. 9–15 Nm³/h over the design range. Total blower capacity = biological aeration + scouring + 20% standby. In our example: 15 (bio) + 12 (scour) = 27 Nm³/h nominal, ×1.2 = 32 Nm³/h. A single 40 Nm³/h roots blower with one standby covers the duty.
Waste activated sludge (WAS) production is 0.15–0.3 kg DS per kg COD removed. With 60 kg COD/d removed and an observed yield of 0.25, WAS = 15 kg DS/d, or ~450 kg DS/month at 2% solids (22.5 m³/month). A small plate-and-frame filter press sized at 1–2 m³/h hydraulic handles this comfortably on a once-per-week cycle. Return activated sludge (RAS) at 1.0–1.5× Q maintains the 6,000–10,000 mg/L MLSS setpoint in the aeration tank.
Worked Example: 30 m³/day Stamping Press MBR
Collapsing the six steps into a single bill of quantities for a 30 m³/day press shop producing 2,000 mg/L COD, 500 mg/L oil, 800 mg/L TSS. All numbers are sizing outputs from the methodology above, no padding.
| Item | Design value | Driver |
|---|---|---|
| Inlet flow (Q) | 30 m³/d | Composite sample, 3 days |
| DAF pretreatment (mandatory) | Oil ≤ 50 mg/L out | Protects MBR flux |
| EQ tank | 240 m³, 8–16 h HRT | Peak/avg = 3:1 over 4 h |
| Aeration tank | 75 m³, 60 h HRT | F/M 0.1, MLSS 8,000 mg/L |
| Membrane area | 104 m² (1 × 225 m² cassette) | Flux 12 L/m²·h, 30% margin |
| Blower capacity | 40 Nm³/h (1 + 1 standby) | Bio + scour + 20% standby |
| WAS production | 15 kg DS/d | Yield 0.25 kg DS/kg COD |
| Sludge dewatering | 1–2 m³/h plate press | Weekly batch operation |
| Effluent target | COD ≤ 50, oil ≤ 2, TSS ≤ 1 mg/L | Meets GB/T 31962 一级A and EPA 40 CFR 433 |
Footprint is roughly 60% of an equivalent CAS + clarifier system. Power draw is dominated by the blower at ~3–4 kW continuous. This is the document a plant engineer hands to an MBR vendor for a stamped quote.
Frequently Asked Questions
Why must DAF pretreatment be installed before the MBR on stamping press wastewater?
Emulsified oil at 50–500 mg/L is the limiting foulant for 0.1 µm PVDF membranes. A DAF or chemical emulsion-breaking stage drops total oil to ≤ 50 mg/L before the biological tank, which extends MBR flux cycles from 1–3 months to 6–12 months between CIPs. The full DAF sizing methodology for oily industrial streams walks through that pretreatment stage.
What F/M ratio should I use for an oily MBR versus a municipal MBR?
Design at 0.05–0.15 kg COD/kg MLSS·d for oily feeds, well below the 0.2–0.5 used for municipal MBR. Hydrocarbons inhibit nitrifiers and slow oil-degrader kinetics (per Capodici et al., MDPI Water 2017), so the slower F/M retains a denser, more diverse biomass. Higher F/M on oily feeds produces foaming, poor floc, and chronic TMP rise.
How often will the membranes need chemical cleaning on a stamping plant MBR?
With DAF pretreatment holding inlet oil at ≤ 50 mg/L, expect CIP every 3–6 months using 1,000–2,000 mg/L NaOCl + 1,000 mg/L citric acid. Without DAF, CIP intervals drop to 4–8 weeks and membrane life falls from 5–7 years to 2–3 years. The CIP interval is the single best field indicator of whether pretreatment is correctly sized.
Related Equipment
- Dissolved air flotation (DAF) system — specifications, capacity range, and technical data