Why Regional Analysis Matters for Wastewater Biogas in 2026
Wastewater-derived biogas and biomethane — often upgraded to renewable natural gas (RNG) for grid injection — generate a global market valued near $89.7B in 2026, with regional economics split by three independent levers: policy support, wastewater composition, and CAPEX/OPEX band (biogas from wastewater market drivers 2026). A project model that works in Lower Saxony will not work in São Paulo, because feed-in tariffs, COD loads, and digester CAPEX diverge by 3–5× across regions. Anaerobic digestion (AD) of industrial and municipal wastewater covers the full scope of this analysis: mesophilic (35°C) and thermophilic (50–55°C) digesters, plus biomethane upgrading via water scrubbing, amine absorption, or membrane separation.
Germany, China, the U.S., the U.K., and India lead 2026 installed capacity — driven by EEG 2023 amendments, the 14th Five-Year Plan industrial WWTP mandate, California LCFS credits, the Green Gas Support Scheme, and the SATAT compressed biogas programme, respectively. The remainder of this article maps each region by installed base, policy driver, typical CAPEX, and the wastewater stream most likely to support a bankable 2026 project.
Europe: Largest Installed Base, Mature Feed-In Tariffs
Europe holds the largest installed anaerobic digester fleet in 2026, with Germany alone operating roughly 9,500 biogas plants — a substantial share of them fed by industrial wastewater from breweries, starch processors, and dairy operations under the EEG 2023 amendments, which extended tariff eligibility for manure- and wastewater-based AD through 2028. The U.K. replaced the Renewable Heat Incentive with the Green Gas Support Scheme (GGSS), which provides quarterly tariff payments for biomethane injected to grid from WWTP sludge and co-digested industrial feedstocks, with tariffs indexed at £0.0736/kWh in Q1 2026.
France and the Nordics lead on co-digestion of municipal sludge with food-industry wastewater, with typical digester hydraulic retention times of 20–30 days at 35°C producing 0.25–0.45 m³ biogas/m³ influent. Across Europe, 2026 CAPEX for AD + CHP installations runs €2,500–€6,000 per kWe of installed electrical capacity, with grid-injection biomethane projects adding another €800–€1,500/kW for upgrading skids.
| Country | 2026 Installed AD Plants (est.) | Primary Policy Driver | Dominant Wastewater Stream | CAPEX Range (€/kWe) |
|---|---|---|---|---|
| Germany | ~9,500 | EEG 2023 amendments | Food processing, manure + industrial co-digestion | 3,500–6,000 |
| U.K. | ~700 | Green Gas Support Scheme | Municipal sludge, food & beverage | 3,200–5,500 |
| France | ~600 | Feed-in tariff ( arrêté S21) | Municipal sludge + agro-industry | 2,800–4,800 |
| Sweden/Denmark | ~400 (combined) | Certificates + grid injection premium | Municipal sludge, dairy | 2,500–4,500 |
Asia-Pacific: Fastest-Growing Region for Wastewater Biogas
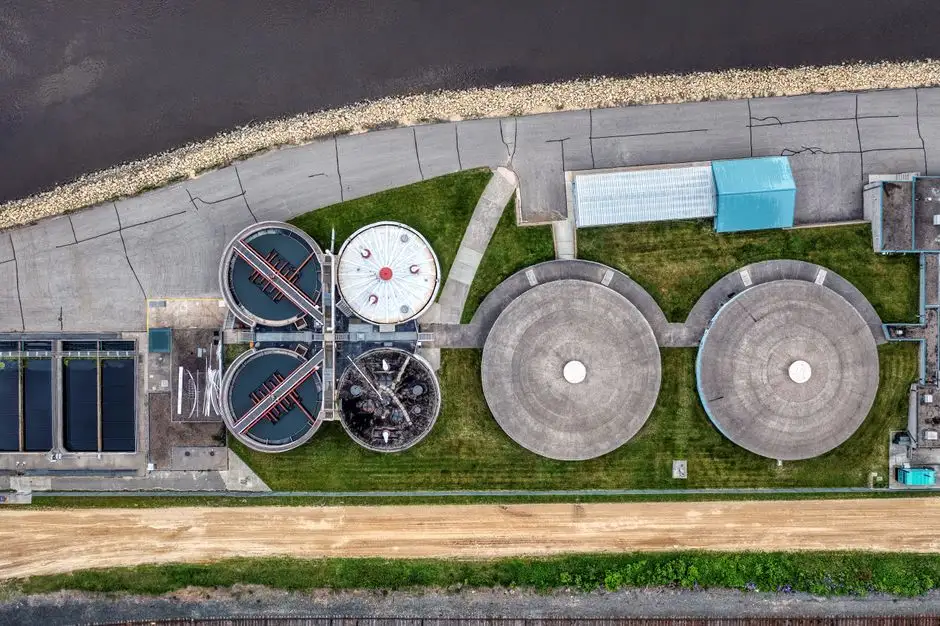
Asia-Pacific is the fastest-growing region in 2026, with capacity expanding at roughly 8–9% CAGR. China's 14th Five-Year Plan mandates biogas recovery at industrial WWTPs above 100,000 m³/day in brewing, starch, and pulp/paper sectors; installed AD capacity in those sectors grew approximately 9% year-over-year through 2025. India is scaling compressed biogas (CBG) under the SATAT scheme, which targets 5,000+ CBG plants by 2026 — most of them fed by distillery spent wash (1.0–1.5% v/v COD residuals) and sugar mill wastewater.
Japan's biomass-derived FIT supports sewage WWTP biogas upgrading, with roughly 70% of large municipal WWTPs (>50,000 PE) now operating digesters. Southeast Asia is the volume play: palm oil mill effluent (POME) and tapioca starch wastewater deliver exceptional yields of 25–32 m³ CH₄/ton COD loaded, which is 3–4× higher than typical municipal sludge. Asia-Pacific CAPEX for 2026 digester projects typically runs $800–$2,200/kWe — 40–60% below European levels — though OPEX per m³ treated is often comparable once staffing and consumables are normalized.
| Country | 2026 Growth Rate (CAGR) | Policy Driver | Dominant Wastewater Stream | CAPEX Range ($/kWe) |
|---|---|---|---|---|
| China | ~9% | 14th Five-Year Plan industrial WWTP mandate | Brewery, starch, pulp/paper | 900–1,800 |
| India | ~12% (CBG) | SATAT scheme, 5,000+ CBG target | Distillery spent wash, sugar | 1,200–2,200 |
| Japan | ~3% | Biomass FIT, sewage WWTP subsidies | Municipal sewage sludge | 1,800–3,000 |
| Indonesia/Malaysia | ~7% | ISCC sustainability certification, export RNG | POME, tapioca starch | 800–1,500 |
North America: RNG, LCFS Credits, and Livestock-Wastewater Hybrids
North America — particularly the U.S. — runs the most policy-intensive biomethane model in 2026, layered between federal RFS RINs and California LCFS credits. California projects hit biomethane breakeven at roughly $0.55/GGE once LCFS credit stacking is included, compared to a national average near $0.85/GGE. Canada supports biomethane in British Columbia and Québec with long-term purchase agreements up to $20/GJ under the BC Biomethane and Energy Recovery and Reuse Program.
Food & beverage wastewater co-digested with dairy manure dominates new 2026 U.S. RNG buildouts; slaughterhouse and brewery streams are the second tier. U.S. digester CAPEX ranges $3,500–$7,500/kWe for 2026 builds, but high tipping fees of $0.20–$0.40/m³ in states like California, Vermont, and New York meaningfully shorten payback — often to 4–6 years for projects securing both LCFS and RIN revenue.
| Market | 2026 Breakeven (USD/GGE) | Primary Revenue Stream | Dominant Wastewater Stream | CAPEX Range ($/kWe) |
|---|---|---|---|---|
| California (U.S.) | ~$0.55 | LCFS + RFS RINs | Dairy manure + food processing | 4,500–7,500 |
| U.S. National Average | ~$0.85 | RFS RINs + state RECs | Slaughterhouse, brewery, F&B | 3,500–6,000 |
| British Columbia (CAN) | ~$0.70 | BC biomethane purchase agreement (~$20/GJ) | Municipal sludge + agro-industry | 4,000–6,500 |
| Québec (CAN) | ~$0.75 | Green hydrogen/biomethane programme | Pulp/paper, municipal | 3,800–6,200 |
Latin America, Middle East & Africa: Emerging Pockets
Latin America, the Middle East, and Africa represent 2026 emerging-pockets rather than primary markets — but the project economics work in targeted segments. Brazil's sugarcane vinasse and ethanol-stillage biogas is the most mature stream, with Biogás Brasil projects routinely delivering 15–25 m³ CH₄/ton COD at ethanol plants. Mexico is scaling brewing WWTP AD through private concessions, often paired with carbon-credit monetization under voluntary markets.
Saudi Arabia and the UAE are tying WWTP biogas to NEOM and Masdar circular-economy targets; brewery and dairy drivers dominate the feedstock mix, and Dubai's Dewa has issued biomethane offtake RFPs through 2027. South Africa leads African deployment via landfill + industrial WWTP hybrid projects, while Egypt's 2025–2030 National Sanitation Plan includes biogas recovery at major WWTPs in Cairo and Alexandria. The binding constraint across all three regions is off-taker PPA security — most projects stall at financial close without a creditworthy offtaker, so 2026 developers should treat PPA negotiation as the gating deliverable, not an afterthought.
Wastewater Stream to Biogas Yield: 2026 Benchmarks
Wastewater-stream selection determines the 2026 project's gas output, CAPEX payback, and regional fit more than any other technical decision. Brewery wastewater consistently delivers the highest industrial yield at 0.30–0.55 m³ biogas/m³ treated with 60–70% CH₄ content, which is why it anchors the priority investments in Germany, China, and Mexico. Municipal sewage sludge generates 0.15–0.25 m³ biogas/m³ treated and roughly 10–12 m³ CH₄/ton VS at standard mesophilic conditions of 35°C with 18–22 day SRT.
Asian POME and starch wastewater are the volume outliers at 25–32 m³ CH₄/ton COD loaded, reflecting both higher substrate concentration (15,000–35,000 mg/L COD) and longer hydraulic retention. Textile and pulp/paper streams sit at 0.10–0.20 m³ biogas/m³ — lower yield per cubic meter, but the absolute flow volumes often compensate. For developers sizing a stream, the limiting variables are influent COD (typically 2,500–35,000 mg/L), temperature stability, and sulfate content, with the latter above 500 mg/L known to inhibit methanogens without iron-dosing pretreatment — a unit operation a compact underground sewage package plant can be specified to deliver.
| Wastewater Stream | Biogas Yield (m³/m³ influent) | CH₄ Content | Specific Yield Benchmark | Typical Region |
|---|---|---|---|---|
| Brewery wastewater | 0.30–0.55 | 60–70% | — | Germany, China, Mexico |
| Food & beverage (general) | 0.25–0.45 | 60–70% | — | EU, U.S., India |
| Municipal sewage sludge | 0.15–0.25 | 60–65% | 10–12 m³ CH₄/ton VS | Global |
| POME / starch (Asia) | — | 65–72% | 25–32 m³ CH₄/ton COD | Indonesia, Malaysia, Vietnam |
| Distillery spent wash (India) | — | 60–68% | 18–24 m³ CH₄/ton COD | India |
| Textile / pulp & paper | 0.10–0.20 | 55–65% | — | China, Brazil, Canada |
2026 Regional Decision Framework: Where to Build
Converting the regional data into a go/no-go decision matrix comes down to three variables: policy value per m³ of gas, wastewater stream yield, and CAPEX band. Priority 1 regions combine a high-value policy with a high-yield stream — Germany (brewery/F&B under EEG), U.S. California (dairy + food processing under LCFS/RFS), China brewery belt, and India CBG under SATAT. Priority 2 covers mature policy paired with mid-yield streams: U.K. municipal sludge under GGSS, France municipal co-digestion, and Japan sewage WWTP under FIT.
Priority 3 covers emerging markets where off-taker PPA security is achievable: Brazil sugarcane vinasse, UAE brewery and dairy tied to Masdar/NEOM, and South Africa industrial WWTP hybrids. Across all priorities, equipment selection follows from influent characteristics — a high-solids brewery stream typically needs a DAF pre-treatment unit ahead of the digester, the digester itself uses an MBR membrane bioreactor system for downstream polishing, and dewatering a plate and frame filter press handles the digestate cake at 22–28% DS — well within the 2026 European and U.S. transportable cake range.
| Priority | Region | Policy Lever | Recommended Stream | 2026 CAPEX Band |
|---|---|---|---|---|
| 1 | Germany | EEG 2023 | Brewery, F&B, manure co-digestion | €3,500–€6,000/kWe |
| 1 | U.S. (California) | LCFS + RFS RINs | Dairy + food processing | $4,500–$7,500/kWe |
| 1 | China (brewery belt) | 14th Five-Year Plan | Brewery, starch | $900–$1,800/kWe |
| 1 | India (CBG) | SATAT scheme | Distillery spent wash, sugar | $1,200–$2,200/kWe |
| 2 | U.K. | Green Gas Support Scheme | Municipal sludge + F&B | £3,200–£5,500/kWe |
| 2 | France / Nordics | Feed-in tariffs | Municipal co-digestion | €2,800–€4,800/kWe |
| 2 | Japan | Biomass FIT | Sewage sludge | $1,800–$3,000/kWe |
| 3 | Brazil / Mexico | Voluntary carbon + concessions | Sugarcane vinasse, brewery | $1,000–$2,000/kWe |
| 3 | UAE / Saudi Arabia | NEOM / Masdar offtake | Brewery, dairy | $1,500–$2,800/kWe |
| 3 | South Africa / Egypt | Sanitation-plan mandates | Industrial WWTP + landfill | $1,200–$2,500/kWe |
Frequently Asked Questions
Which region leads the global wastewater biogas market in 2026? Europe holds the largest installed base, with Germany alone operating roughly 9,500 AD plants; the global market sits near $89.7B in 2026.
Where is wastewater biogas capacity growing fastest in 2026? Asia-Pacific is the fastest-growing region at approximately 8–9% CAGR, led by China's 14th Five-Year Plan industrial WWTP mandate and India's SATAT scheme targeting 5,000+ CBG plants.
Which wastewater stream delivers the highest biogas yield in 2026? POME and tapioca starch wastewater in Southeast Asia deliver 25–32 m³ CH₄ per ton COD loaded, with brewery wastewater a close second at 0.30–0.55 m³ biogas per m³ influent.
What is the typical 2026 CAPEX for a wastewater-fed digester? CAPEX ranges from $800–$2,200/kWe in Asia-Pacific to €2,500–€6,000/kWe in Europe and $3,500–$7,500/kWe in North America, depending on upgrading configuration.
Which policy delivers the strongest 2026 project economics? California LCFS combined with federal RFS RINs produces biomethane breakeven near $0.55/GGE, the lowest 2026 figure among major markets, ahead of the U.K. GGSS at £0.0736/kWh and Germany's EEG tariff.