How Big Is the Nutrient Recovery Market in 2026?
The global nutrient recovery market sits between USD 5.92 billion and USD 8.2 billion in 2026, depending on which boundary the analyst draws around the value chain. The lower figure, USD 5.92B, comes from Coherent Market Insights' Nutrient Recycling Market report dated 29 Apr 2026, and measures downstream agronomic output — fertilizers, soil amendments, and recycled nutrient products sold into agriculture. The higher figure, USD 8.2B, comes from a Nutrient Recovery Systems Market study with a 2025 base year and data verified in May 2026, and measures capital equipment plus integrated systems sold to utilities and industrial facilities.
Forward projections preserve the same split. The recycling-market methodology projects USD 8.96B by 2033 at a 6.1% CAGR, while the systems-market methodology projects USD 14.7B by 2034 at a 7.3% CAGR. Both trajectories are credible; they answer different questions. A procurement manager evaluating whether to install a struvite reactor at a 150 m³/d food-processing plant cares about the 8.2B equipment denominator because that is what is being purchased. A corporate strategist building a circular-economy thesis cares about the 5.92B recycling denominator because that is the addressable market for the recovered product.
| Methodology | 2026 Market Size | Forecast Year | Forecast Value | CAGR | Scope |
|---|---|---|---|---|---|
| Coherent Market Insights (Nutrient Recycling) | USD 5.92B | 2033 | USD 8.96B | 6.1% | Agronomic recycled products (fertilizers, soil amendments) |
| Q4 2025 verified May 2026 (Nutrient Recovery Systems) | USD 8.2B | 2034 | USD 14.7B | 7.3% | Capital equipment and integrated recovery systems |
For most industrial-wastewater decision-makers, the systems figure is the more actionable baseline because CAPEX, installation, and integration dominate project economics. The recycling figure becomes relevant once a facility starts generating sellable product and needs a market price reference.
Market Segmentation by Nutrient and Source Stream
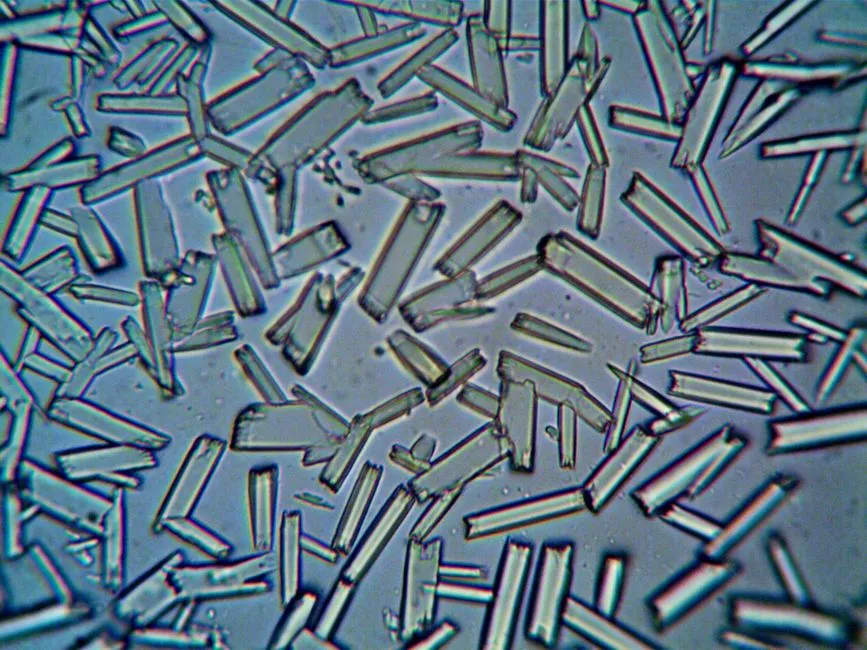
Nutrient recovery splits into three primary lanes — nitrogen, phosphorus, and potassium — each with distinct technology maturity and economics. Phosphorus recovery leads on commercial activity: struvite (MgNH₄PO₄·6H₂O) and calcium phosphate precipitation are deployed at full scale, and recovered phosphorus products command $280–$420 per metric ton in Danish, German, and Dutch municipal procurement contracts (Q4 2025 verified May 2026). Nitrogen recovery sits in mid-maturity: biological nitrogen removal via nitrification-denitrification is standard in municipal wastewater treatment plants, but side-stream ammonia stripping, ion exchange, and recovery as ammonium sulfate are still scaling. Potassium recovery from wastewater remains nascent, with most potassium in municipal and industrial streams ending up in biosolids rather than a discrete recovered product.
Municipal wastewater remains the largest single source stream, where anaerobic digestion, composting, and struvite crystallization dominate the technology mix. However, industrial wastewater is the standout growth segment at 8.4% CAGR and 32.1% market share (Q4 2025 verified May 2026). Food processing, chemical manufacturing, and pharmaceutical production streams carry 3–10x the nutrient concentration of typical municipal influent, which shrinks reactor sizing and improves the unit economics of any recovery technology bolted onto the effluent train. Industrial end-users in those three sectors command 33.2% combined share of the broader market.
| Segment | Market Share / Maturity | Representative Technology | Key Driver |
|---|---|---|---|
| Phosphorus recovery | Largest commercial sub-segment; $280–$420/ton product pricing in EU | Struvite crystallization, calcium phosphate precipitation | Phosphate rock scarcity, EU fertilizer regulations |
| Nitrogen recovery | Mid-maturity; biological removal standard, side-stream recovery scaling | Ammonia stripping, ion exchange, MBR nitrification-denitrification | Nitrogen discharge limits, ammonium sulfate market |
| Potassium recovery | Nascent; mostly co-bound in biosolids | Selective ion exchange (pilot scale) | Limited standalone economic case |
| Industrial wastewater (source) | 32.1% share, 8.4% CAGR | DAF pre-concentration, MBR, struvite reactors | High influent nutrient concentrations, compliance plus byproduct revenue |
| Municipal wastewater (source) | Largest single channel | Anaerobic digestion, struvite reactors, composting | EPA/state nutrient criteria, EU Urban Wastewater Treatment Directive |
Per-nutrient dollar splits were not disclosed in the surfaced SERP data, so the table above grades relative technology maturity and commercial traction rather than assigning a fabricated share. Phosphorus recovery is where buyers will find the most mature off-take agreements and equipment vendor competition today.
Regional Outlook: Where the 2026 Growth Is Concentrated
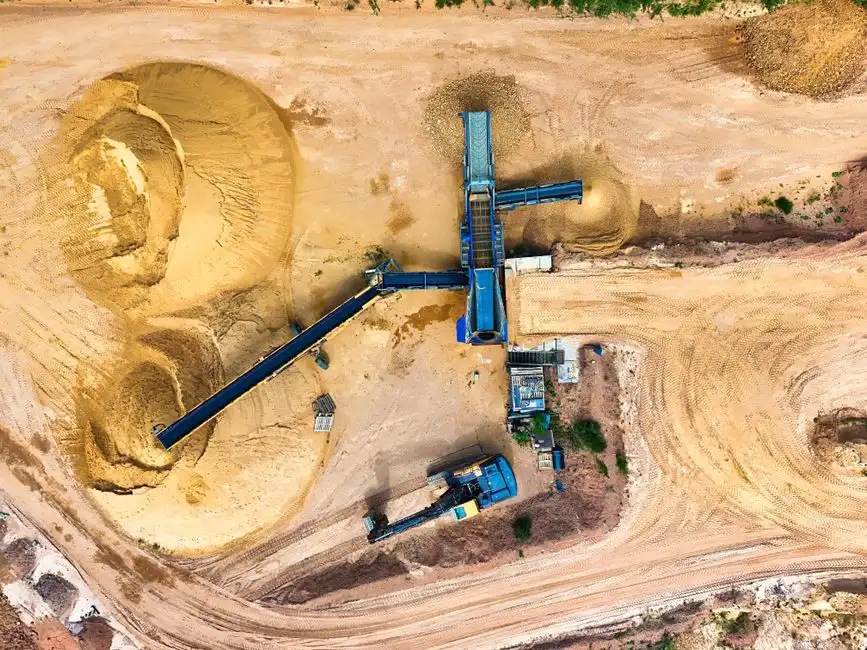
North America holds more than 35% of the global nutrient recovery market in 2026, the largest regional share by a clear margin (Coherent Market Insights, 29 Apr 2026). The driver is regulatory: EPA nutrient pollution concerns, state-level total maximum daily loads (TMDLs) for nitrogen and phosphorus, and intensive agricultural and livestock regions in the U.S. Midwest and Canadian Prairies that generate both the wastewater and the demand for recovered fertilizer products. The U.S. and Canada have both implemented programs that couple nutrient recovery technology adoption with cost-share funding for municipal upgrades.
Europe is the established procurement market for recovered products. Municipalities in Denmark, Germany, and the Netherlands are paying $280–$420 per metric ton for recovered phosphorus under multi-year contracts, giving vendors a visible revenue model that North American utilities are only beginning to replicate. Asia Pacific is the fastest adopter by deployment count: 850 municipal systems came online between 2024 and 2026 (Q4 2025 verified May 2026), driven by circular-economy programs in China, Japan, and South Korea that integrate nutrient recovery as a cornerstone technology. For an equipment supplier, the APAC volume is the leading indicator of where replacement and expansion orders will land in 2027–2029.
The Middle East, Africa, and Latin America are emerging adoption zones, with growth tied to industrial discharge compliance — oil and gas produced water, mining effluent, and agro-processing streams — rather than municipal nutrient reduction targets. Surfaced SERP data does not yet quantify these regions' share, but the regulatory drivers are identifiable: Saudi Arabia and the UAE are tightening effluent nutrient limits for desalination brine discharge; Brazil's agro-processing sector is under pressure to reduce nitrogen and phosphorus loads in receiving waters. These are the markets where industrial vendors typically enter first, ahead of municipal follow-on demand.
What This Means for Industrial Wastewater Equipment Buyers
Industrial wastewater is the highest-CAGR segment in the nutrient recovery market because nutrient concentrations in food processing, chemical, and pharmaceutical effluent are typically 3–10x higher than municipal influent (Q4 2025 verified May 2026). Higher concentration means smaller reactors, shorter residence times, and lower CAPEX per kilogram of nutrient recovered — the unit economics that make a recovery line item pencil out before any green-premium financing enters the calculation.
Four equipment categories capture most of the industrial nutrient recovery spend. A DAF system for phosphorus-rich sludge pre-concentration is typically the first unit in the train, floating suspended solids and adsorbed phosphate before the stream hits the reactor. An MBR system for biological nitrogen removal handles nitrification-denitrification when the influent C:N ratio permits biological treatment. Struvite crystallization reactors recover phosphorus as a sellable solid, and PLC-controlled chemical dosing for struvite precipitation provides the magnesium and pH control that drives the crystallization reaction to completion.
The ROI math is the deciding factor. At $280–$420 per metric ton of recovered phosphorus under an EU-style off-take contract, a 50–200 m³/d industrial stream generating 0.5–2.0 tons of recoverable P per year produces $140–$840k in annual gross product revenue, before avoided disposal costs and any nutrient-discharge compliance savings. That range supports a 3–7 year simple payback on installed recovery equipment, depending on whether the facility already operates a DAF or MBR upstream. The procurement question is no longer "can we afford to add nutrient recovery?" — it is "can we afford to keep treating nutrients purely as a compliance cost when the recovered-product line is sitting at $280+ per ton?" For most 50–200 m³/d food and pharma streams, the answer is shifting toward the recovery side of the ledger.
Frequently Asked Questions
What is the nutrient recovery market worth in 2026? Between USD 5.92 billion and USD 8.2 billion, depending on methodology. The 5.92B figure (Coherent Market Insights, 29 Apr 2026) covers recycled nutrient products sold into agriculture; the 8.2B figure (Q4 2025 verified May 2026) covers capital equipment and integrated recovery systems. Use the systems figure for CAPEX planning and the recycling figure for off-take market sizing.
Which segment is growing fastest? Industrial wastewater, at 8.4% CAGR against a market average of 6.1–7.3% (Q4 2025 verified May 2026). Food processing, chemical manufacturing, and pharmaceutical production drive the segment because their influent nutrient concentrations are 3–10x higher than municipal streams.
What is recovered phosphorus worth? $280–$420 per metric ton under municipal procurement contracts in Denmark, Germany, and the Netherlands (Q4 2025 verified May 2026). Pricing in North American and Asian off-take markets is less standardized but tracks the EU range as supply tightens.
How many municipal systems have been deployed recently? 850 municipal nutrient recovery systems were installed across Asia Pacific between 2024 and 2026, the steepest geographic adoption curve in the market (Q4 2025 verified May 2026).
Who are the leading vendors? The competitive landscape — Ostara, Veolia, Suez, DVO, Xylem, and others — is covered in the nutrient recovery key players 2026 vendor comparison, which maps each vendor to its primary recovery technology and regional footprint.