What "Online Oil and Grease Analyzer" Actually Measures in Wastewater
An online oil and grease analyzer for wastewater continuously measures free, emulsified, and dissolved hydrocarbons in real time, eliminating the lag of grab-sample lab work that typically misses 60-80% of FOG spikes. The five dominant measurement principles are UV fluorescence (detection limit ~0.1 ppm), FTIR, solvent-extraction density, ultrasonic, and light-scatter turbidity, each suited to a different stage of the treatment train. Correct placement at the API separator outlet, DAF inlet, or final effluent determines whether the analyzer protects downstream biology or just logs compliance data.
Per the Yokogawa refinery framework, oil in wastewater appears in three physical forms that dictate both removal technology and analyzer selection. Free oil (also called floating oil) separates by gravity and is removable by skimming or an API separator. Emulsified oil consists of stable droplets requiring chemical pH adjustment followed by air flotation to break. Dissolved oil is a true molecular solution and only treatable by biological metabolism or adsorption. The regulatory definition anchors on EPA Method 1664, an n-hexane extraction followed by gravimetric weighing with a typical detection floor near 5 mg/L and a practical working range around 50 ppm in refinery and food-industry effluents.
Grab sampling on a 4-24 hour interval fails because FOG discharge is transient—slug loads from desalter dumps, batch food-cleaning cycles, or pigging operations push short-lived spikes far above baseline. A single 2-hour excursion above 100 mg/L O&G can suppress biomass activity in an activated-sludge basin for 30-72 hours, costing a refinery or food plant days of recovery and possible permit noncompliance. Five measurement principles address this gap: UV fluorescence, FTIR, solvent-extraction density, ultrasonic/acoustic, and light-scatter turbidity.
How the Five Measurement Technologies Compare
UV fluorescence excites aromatic hydrocarbons at 254 nm and quantifies emission intensity, achieving a detection limit near 0.1 ppm with response under 60 seconds. It is the default choice for trace hydrocarbons in treated effluent and for dissolved-oil breakthrough monitoring, though it remains sensitive to interferences from other aromatic compounds. FTIR performs a full mid-IR scan, identifies oil species, and quantifies without solvent consumption; detection limits land in the 1-5 ppm band, response runs 1-3 minutes, and the technique fits emulsified-oil monitoring at the DAF outlet where multi-species discrimination matters—at the cost of higher CAPEX and clean optics.
Solvent-extraction density analyzers extract oil into n-hexane or S-316 solvent and measure the density change; the working range is 0-200 ppm at 0.1 ppm resolution over a 2-5 minute cycle, making the principle well suited to high-concentration influent monitoring, with 5-10 mL solvent per cycle as the main recurring cost. Ultrasonic/acoustic sensors correlate high-frequency sound attenuation and speed to oil content, deliver a 5-10 ppm detection floor, and are robust to fouling—a fit for free-oil and emulsified streams in refinery desalters and produced water. Light-scatter/turbidity is an indirect proxy that reads as a screening trend signal at the API separator outlet but cannot replace a calibrated O&G measurement for compliance.
| Principle | Detection limit | Response time | Solvent use | Maintenance interval | CAPEX band (USD/stream) | Best-fit application |
|---|---|---|---|---|---|---|
| UV fluorescence | 0.01-0.1 ppm | <60 s | None | Weekly cal, 12-18 mo lamp | $18,000-$45,000 | Dissolved oil, final effluent, biological inlet |
| FTIR | 1-5 ppm | 1-3 min | None (or minimal) | Monthly cal, 4-8 wk cell clean | $35,000-$90,000 | Emulsified oil at DAF outlet, multi-species |
| Solvent-extraction density | 0-200 ppm range, 0.1 ppm resolution | 2-5 min | 5-10 mL/cycle | Daily verification, tubing 3-6 mo | $8,000-$25,000 | High-concentration influent, refinery desalter |
| Ultrasonic/acoustic | 5-10 ppm | <60 s | None | Quarterly transducer check | $20,000-$55,000 | Free/emulsified oil, produced water, fouling-prone streams |
| Light-scatter/turbidity | 10-50 ppm equivalent | <30 s | None | Monthly wipe, weekly blowdown | $3,000-$10,000 | API separator outlet trend signal only |
This matrix serves as a selection tool. If the duty is dissolved-oil breakthrough at sub-ppm levels, UV fluorescence wins on detection limit and reagent-free operation. If the duty is emulsified-oil speciation at the DAF outlet, FTIR is the only principle that discriminates oil chemistry without solvent. If the duty is high-concentration influent at low CAPEX, solvent-extraction density is the workhorse.
Detection Limit, Response Time, and Accuracy Benchmarks
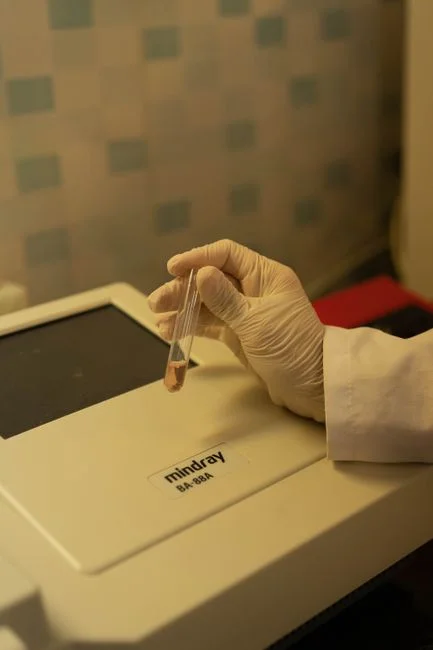
Procurement specifications require hard numbers to define performance standards. UV fluorescence delivers a 0.01-0.1 ppm detection band, sub-60-second response, and ±5% of reading or ±0.1 ppm accuracy, with weekly calibration against a known-concentration standard. FTIR sits at 1-5 ppm detection, 1-3 minute response, and ±2-5% accuracy on a multi-point calibration refreshed monthly with hexane blank and standard. Solvent-extraction density spans 0-200 ppm at 0.1 ppm resolution with ±2% accuracy—but that figure is contingent on solvent batch purity, and daily verification is the standard. Ultrasonic measures 5-10 ppm with sub-60-second response and accuracy near ±10% in fouled service, where the fouling correction is the real engineering challenge. Light-scatter/turbidity reads 10-50 ppm equivalent, sub-30-second response, and functions as a proxy rather than a calibrated O&G value.
For compliance reporting, EPA Method 1664 equivalence is the gate. UV fluorescence and FTIR are routinely accepted by U.S. regulators when the analyzer is operated under a documented Quality Assurance Project Plan (QAPP) and cross-checked against Method 1664 at a defined frequency. Solvent-extraction density analyzers correlate more directly because the measurement principle overlaps the laboratory method, but the field engineer still owes a QAPP and a periodic split-sample audit. The HydropureWater specification template, derived from refinery field data (2026), recommends monthly Method 1664 cross-checks during commissioning, then quarterly once correlation is established.
Where to Install the Analyzer in the Treatment Train
Proper placement turns the analyzer from a compliance logger into a process-control instrument. At the API separator outlet, the duty is free-oil verification and skimmer trigger logic; install ultrasonic or light-scatter here, where free-oil fractions typically run 20-100+ ppm and the measurement tolerates the solids load. At the DAF inlet, the duty is coagulant and polymer dose control; install UV fluorescence or FTIR to feed real-time chemical dosing—closed-loop control typically cuts chemical consumption 15-25% compared to flow-paced dosing, and the upstream stage is best served by a micro-bubble DAF system for emulsified-oil removal that the analyzer closes the loop on.
At the biological treatment inlet, install a UV fluorescence analyzer as the early-warning guard for emulsified or dissolved oil spikes that would otherwise suppress biomass; alarm setpoints land at 50-100 mg/L depending on MLVSS concentration and food-to-microorganism ratio. At the final effluent, install UV fluorescence to demonstrate continuous compliance with the discharge permit, which for refinery and food-industry outfalls typically requires <5-10 mg/L O&G. Sample conditioning is not optional: a Y-strainer, automatic backflush, and chilled sample line prevent fouling, and without them analyzer accuracy degrades 30-50% within weeks of service—the most common cause of "the analyzer doesn't work" complaints traced back from the field.
For facilities dosing coagulant or polymer into the FOG stream, a PLC-controlled coagulant and polymer dosing skid pairs naturally with the analyzer output and lets the dose track real influent FOG rather than flow alone.
Maintenance Burden, Operating Cost, and CAPEX Bands
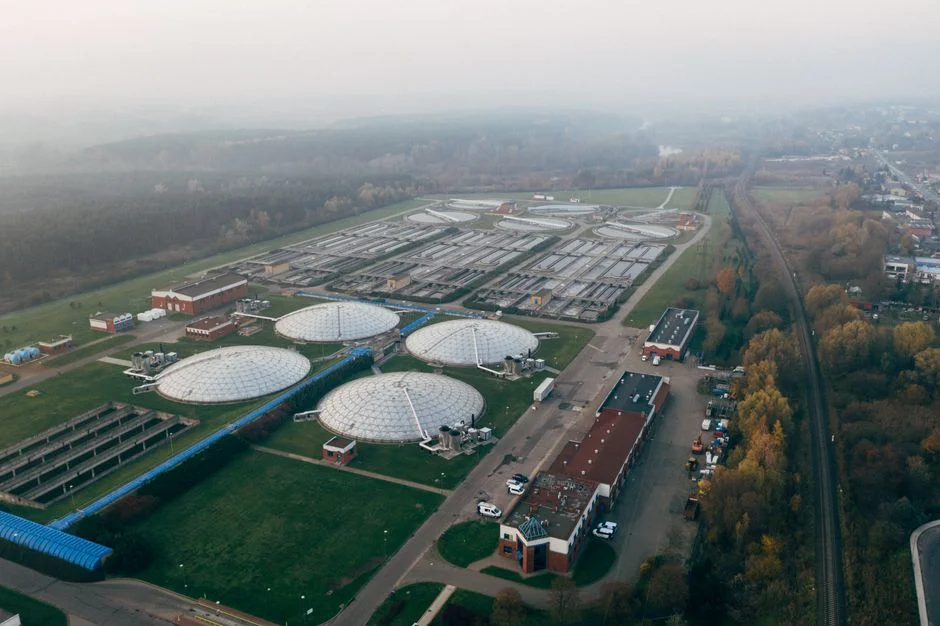
Budget envelopes must be established before the requisition lands. UV fluorescence units sit in the $18,000-$45,000 per-stream CAPEX band, run reagent-free, and consume OPEX mainly on calibration standards and lamp replacement every 12-18 months. FTIR analyzers run $35,000-$90,000 per stream with OPEX driven by IR cell cleaning every 4-8 weeks and any solvent if the design uses extractive sampling. Solvent-extraction density analyzers are the lowest-CAPEX option at $8,000-$25,000 per stream, but OPEX is dominated by solvent consumption at roughly $2,000-$5,000 per year for continuous monitoring—a number that scales with cycle frequency and number of streams.
Maintenance man-hours per analyzer per month break down as: UV fluorescence 2-4 hours, FTIR 4-8 hours, solvent-extraction 6-10 hours including solvent refill and tubing replacement, ultrasonic 3-5 hours, light-scatter 1-2 hours. The sample-conditioning system—pump, cooler, strainer, blowdown—typically adds $5,000-$15,000 to the total installed cost and is the single most common cause of analyzer downtime in refinery and food-plant service. Budget for it explicitly rather than rolling it into "installation." A complete online O&G analyzer skid with sample conditioning therefore lands in a $25,000-$110,000 total band depending on technology choice, with solvent-extraction at the low end and FTIR at the high end.
Integrating the Analyzer Output with Plant Control Systems
The analyzer signal must reach the operator and the control loop to provide value. Modern units ship with 4-20 mA, Modbus RTU/TCP, and Profinet outputs; verify protocol match with the existing DCS or SCADA before purchase, because protocol converters add latency and failure modes. Map analyzer trends into alarm management per typical refinery practice: high-high alarm at 1.5× permit limit, high alarm at 80% of permit, advisory at 50% of permit. For DAF dose control, feed the analyzer signal into a PLC PID loop on the polymer pump; closed-loop control typically stabilizes effluent FOG within ±10% of setpoint. For control-loop design details specific to food and process wastewater, the PLC control architecture for food and process wastewater plants guide covers the wiring, PID tuning, and failover logic. For predictive maintenance on the downstream biological stage, the digital twin architecture for wastewater treatment plants article explains how to consume the analyzer trend as a model input, and broader AI and machine-learning trends in wastewater treatment point to where online FOG data is heading next.
Frequently Asked Questions

What detection limit does an online oil and grease analyzer typically achieve? UV fluorescence units reach approximately 0.1 ppm in field service, with best-case laboratory detection near 0.01 ppm; FTIR and ultrasonic platforms sit at 1-5 ppm and 5-10 ppm respectively.