Why 2026 Is a Pivotal Year for Industrial Water Reuse
The global water reuse market is on track for roughly 11–15% CAGR through 2026, with industrial reuse representing about 55–60% of total reclaimed volumes. Growth is driven by freshwater scarcity, tightening discharge permits, and falling membrane capex — pushing MBR-plus-RO trains to dominate new industrial reuse builds worldwide.
The headline figure most analysts converge on for 2026 puts the global water reuse market in a $45–60 billion band, expanding at 11–15% CAGR to 2030 (GWI/BlueTech, 2025-Q4). Industrial reuse — not agricultural or potable — is the largest single segment by volume and the fastest by capex velocity. Three structural forces explain the curve. First, freshwater scarcity: the UN projects a 40% gap between water supply and demand by 2030 in water-stressed basins, which is moving reuse from a sustainability talking point onto a plant manager's balance sheet. Second, tightening effluent rules: China's updated GB 18918-2025 discharge standard and the EU's recast Urban Wastewater Treatment Directive (UWWTD) both compress the practical discharge envelope, making reuse the cheaper compliance path. Third, energy and membrane economics: RO membrane module pricing has fallen ~30% since 2020 on polysulfone and thin-film composite scale-up, and bioreactor energy draw has dropped ~20% with high-efficiency aeration diffusers. The 2021 Nature Communications study on Egypt's water balance concluded that current reuse rates and irrigation policies will not close the country's demand gap — a finding that holds as an emerging-market anchor for the broader MENA growth case. Four reuse categories compete for that capex — industrial process, agricultural, indirect potable reuse (IPR), and direct potable reuse (DPR) — and industrial process reuse is the fastest-growing in 2026, pulled by power, F&B, and semiconductor build-outs.
Water Reuse Growth Rate by Region: 2026 Outlook
Regional CAGR bands diverge sharply in 2026, and a procurement reader sizing a multi-site project needs to know whether they are buying into a high-growth scarcity market or a mature compliance market.
| Region | 2026 CAGR band | Dominant driver | 2026 market posture |
|---|---|---|---|
| MENA | 12–16% | Physical freshwater scarcity; energy-sector produced water | Highest growth rate; subsidy-driven |
| Sub-Saharan Africa | 11–15% | Climate-driven supply stress; mining & power demand | High growth, low absolute volume |
| Asia-Pacific | 10–14% | Industrial relocation; electronics and textile exports | Largest absolute reused volume |
| North America | 9–13% | Drought policy; DPR frameworks in TX, CA | Mature, regulation-led |
| Latin America | 8–12% | Mining and F&B export hubs | Mid-tier, project-by-project |
| Europe | 7–11% | Circular economy mandates; UWWTD recast | Slowest, compliance-led |
Two distinctions matter for capacity planners. Asia-Pacific leads on absolute reused volume because of installed manufacturing base, while MENA and Sub-Saharan Africa lead on percentage growth because the baseline is smaller and the scarcity gap is widest. North America looks moderate on the CAGR axis but punches above its weight on DPR — California alone has approved more than 15 DPR/IPR projects since 2023, most co-located with industrial reuse loops. Europe's lower CAGR reflects a mature compliance regime, not weak demand: the UWWTD recast will require reuse for every agglomeration above 100,000 PE by 2030, so a 7–11% band understates the 2027–2030 acceleration. For a 15-year hindsight check: the 2011 ResearchGate paper Direct Potable Reuse: A Future Imperative under-projected the 2026 industrial reuse rate by roughly an order of magnitude — the market has compounded, not linearized, since 2011.
Which Industrial Sectors Are Driving the 2026 Growth Curve
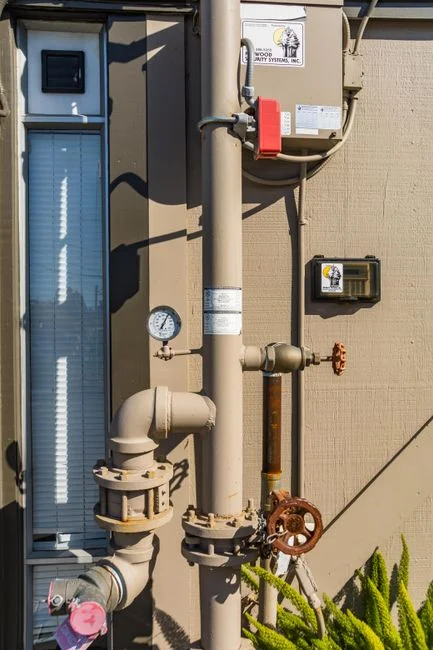
Sector mix matters because each segment pulls a different treatment train, and the capex envelope shifts with influent strength and reuse endpoint.
Power generation and food & beverage each account for roughly 20% of industrial reuse volume globally in 2026 (GWI sectoral split, 2025). Power is dominated by cooling-tower blowdown reuse, where recovery targets of 75–90% are now standard and the limiting step is silica and hardness control, not BOD. Food & beverage spans dairy, brewing, and vegetable processing, where high organic load (COD 3,000–10,000 mg/L) pushes designers toward anaerobic + MBR trains. The fastest-growing 2026 segment, however, is semiconductors at 15–20% within-segment CAGR, driven by ultra-pure water (UPW) recycle rates of 70–90% and the need to drop specific resistivity below 18.2 MΩ·cm at the polishing stage. This segment is the single biggest pull-through for high-rejection RO and electro-deionization (EDI) equipment. Textiles and dyeing, pulp and paper, and oil & gas produced-water reuse round out the top six. In textiles, the ZLD/MLD push in China and India is the driver; in oil & gas, produced-water reuse in the Permian and Middle Eastern fields is moving from disposal to reuse loops at $0.80–$1.50 per barrel of treated water (2026 field data).
Treatment Trains Behind the Growth: What Buyers Are Specifying in 2026
The 2026 default train for industrial reuse is screening → DAF or primary clarification → MBR (or MBBR) → UF/RO → optional polishing with ClO₂ or UV. Variants appear at the high-salinity end (MEE/crystallizer) and the low-salinity end (NF instead of RO).
| Stage | Typical equipment | 2026 design targets | Notes |
|---|---|---|---|
| Pretreatment | Screening, grit removal, DAF or primary clarifier | Remove oils, TSS >50 mg/L, settleable solids | Critical for membrane life downstream |
| Biological | MBR (submerged or sidestream) or MBBR | BOD <10 mg/L, COD <50 mg/L, NH₃-N <1 mg/L | MBR delivers ~60% smaller footprint vs CAS |
| Membrane 1 | UF (0.01–0.05 µm PVDF) | SDI <3 to RO feed, turbidity <0.2 NTU | Standard RO protection stage |
| Membrane 2 | RO (brackish or low-pressure) | TDS reduction 95–99%, conductivity <50 µS/cm for HP reuse | Polishing stage for closed-loop reuse |
| Disinfection/polish | UV (254 nm) or ClO₂ | Coliform ND, residual <0.1 mg/L | Matches EPA 2017 RWBR and EU 2020 minimum requirements |
Reuse-grade effluent targets in 2026 are anchored to the EPA 2017 Water Reuse and Reclamation Guidelines and the EU 2020 minimum requirements: TSS <5 mg/L, BOD <10 mg/L, turbidity <1 NTU, with site-specific limits on metals, conductivity, and pathogens. MBR+RO beats conventional CAS + clarifier on three procurement-relevant axes: ~60% smaller footprint (per MBR product data, 2026), higher and more consistent effluent quality, and easier automation for variable industrial loads. A fit-for-purpose MBR membrane bioreactor for industrial reuse handles the biological stage, while an industrial RO polishing stage delivers the conductivity cuts that cooling-tower, boiler-feed, and process-wash reuse loops require. For buyers evaluating OEMs, the 2026 membrane technology OEM landscape and RO OPEX and membrane replacement costs in 2026 are the two references that translate these trains into real capex and consumables numbers.
Emerging variants to keep on the bid list: MBR+NF for lower-salinity reuse where conductivity limits are loose (cooling-tower makeup in some chemistries); MBR+RO+MEE for brine minimization or true ZLD where discharge cost exceeds $5/m³; and ion exchange as a targeted polishing step for specific ions (boron, silica, nitrate) that slip past RO.
2026 Capex, Opex and ROI: How Growth Is Reshaping Project Economics
Industrial reuse capex in 2026 sits in a $800–$2,500 per m³/day band of installed reuse capacity, with the spread driven by influent variability, target recovery, and the polish stage selected. A simple MBR+RO loop for a steady F&B influent lands near the low end; a power-plant cooling-tower loop with high-recovery RO and silica polishing sits near the top.
OPEX runs $0.15–$0.45 per m³ of reused water, dominated by energy (typically 35–50% of OPEX) and membrane replacement (15–25%). Energy intensity for a modern MBR+RO train falls in the 0.8–1.6 kWh/m³ range; high-recovery designs push that figure up. Water-recovery targets of 70–90% are now the procurement default; ZLD pushes recovery above 95% but roughly doubles capex and adds a thermal stage. Payback lands inside 3–5 years where industrial water tariffs exceed $2–3/m³, and compresses to 2–3 years in water-stressed regions where tariffs are higher or where discharge penalties and freshwater abstraction levies stack on top of avoided purchase cost. In MENA and parts of the US Southwest, several 2025–2026 reuse projects have cleared internal hurdle rates on water-cost savings alone, before counting discharge-avoidance value.
A 2026 Decision Framework: How to Specify a Reuse Project That Matches the Growth
- Define the reuse endpoint. Cooling-tower makeup, boiler feed, process wash, irrigation, and toilet flush each set a different water-quality bar. The endpoint fixes the conductivity, hardness, and pathogen targets before any equipment is sized.
- Match the influent to a train. Low-strength effluent (BOD <500 mg/L, TDS <2,000 mg/L) routes to MBR+UF for non-contact reuse. Mid-salinity or closed-loop requirements route to MBR+RO. Brine minimization or ZLD requirements route to MBR+RO+MEE or crystallizer.
- Sanity-check vendor quotes against the 2026 capex band. $800–$2,500 per m³/day of installed reuse capacity. Quotes materially below this band should trigger questions about scope; quotes above should be tested against scope creep (extra polishing, civil works, redundancy).
- Confirm the train can deliver 70–90% recovery with documented membrane life and OPEX. Ask vendors for membrane-flux warranties, replacement-cycle assumptions, and a 12-month energy draw. A train that hits recovery on day one but forces membrane swap at 18 months will fail the lifecycle case.
Frequently Asked Questions
What is the water reuse market growth rate in 2026? The global water reuse market is growing at roughly 11–15% CAGR in 2026, with industrial reuse representing about 55–60% of total reclaimed volumes (GWI/BlueTech, 2025).
Which region has the highest water reuse growth rate? MENA leads at 12–16% CAGR, driven by acute freshwater scarcity and energy-sector produced-water reuse. Sub-Saharan Africa is close behind at 11–15% on a smaller base.
What is the best treatment for industrial water reuse in 2026? The default is MBR followed by UF/RO, with reuse-grade effluent targets of BOD <10 mg/L, TSS <5 mg/L, and turbidity <1 NTU per EPA 2017 RWBR and EU 2020 minimum requirements. Variants include MBR+NF for low-salinity reuse and MBR+RO+MEE for ZLD.
How much does an industrial water reuse plant cost in 2026? Capex runs $800–$2,500 per m³/day of installed reuse capacity depending on influent and target recovery. Typical payback is 3–5 years at industrial water tariffs above $2–3/m³, faster in water-stressed regions.
What effluent quality is required for industrial water reuse in 2026? Reuse-grade effluent typically requires BOD <10 mg/L, TSS <5 mg/L, turbidity <1 NTU, with site-specific limits on conductivity, metals, and pathogens (EPA 2017 RWBR; EU 2020 minimum requirements).