Why Snack Food Wastewater Is Harder Than General F&B Effluent
Snack lines generate four distinct waste streams that converge at the plant drain, and each one punishes a generic F&B treatment train differently: fryer condensate arrives at 50–80 °C with FOG concentrations of 1,000–3,000 mg/L, seasoning-drum washwater carries 5,000–15,000 mg/L TDS from salt and spice extracts plus 2,000–4,000 mg/L TSS, cooking/boiling water contributes starch-driven COD in the 8,000–20,000 mg/L range, and CIP cleaning effluent swings pH from 2 to 12 within a single shift while adding surfactant load that foams conventional aeration basins. Veolia's F&B practice correctly notes that food and beverage streams typically run high in BOD, COD, nutrients, and suspended solids — but the snack subsector layers 30–55 °C fryer discharge, emulsified oil, and starch gel on top of that baseline, which is why a brewery-spec activated sludge package will fail on a kettle-cooked chip line. The published Xylem/ADI case at Shearer's Foods (Massillon, Ohio) and the documented Golden Flake installation in Birmingham, Alabama both required full biological treatment trains specifically because off-the-shelf F&B packages could not handle the combined FOG-plus-starch loading.
Typical 2026 Influent and Effluent Parameters for Snack Lines
Snack plants do not have one influent number — they have a moving envelope that depends on the day's product mix. The table below aggregates documented ranges from snack-line surveys conducted between 2024 and 2026, normalized to a single composite sample at the equalization basin.
| Parameter | Influent range | Typical discharge target | Governing standard |
|---|---|---|---|
| COD | 5,000–25,000 mg/L | ≤ 250 mg/L | China GB 8978-1996 Class 1; general industrial discharge |
| BOD5 | 2,500–12,000 mg/L | ≤ 30 mg/L | EU IED 2010/75/EU BAT-AEL (Food, Drink & Milk) |
| FOG (oil & grease) | 500–3,000 mg/L | ≤ 10 mg/L | U.S. EPA 40 CFR Part 405 categorical |
| TSS | 1,000–4,000 mg/L | ≤ 100 mg/L | India CPCB Schedule II, snack processing |
| pH | 4–11 (CIP swings) | 6.5–8.5 | Common to all four regimes |
| Temperature | 30–55 °C (fryer discharge) | < 35 °C to biological stage | Process limit, not regulation |
| Total nitrogen | 50–300 mg/L | ≤ 20 mg/L (reuse) / 50 mg/L (discharge) | EU IED BAT-AEL |
The single most common sizing error we see in RFQs is averaging popcorn-line starch data with kettle-chip FOG data and calling it "snack wastewater." A popcorn facility runs mostly starch-driven COD with FOG under 600 mg/L, while a kettle-cooked line routinely exceeds 2,500 mg/L FOG from tallow and palm oil — the equalization tank and DAF sizing change by a factor of three between those two cases.
The Two Process Trains That Work for Snack Food Wastewater
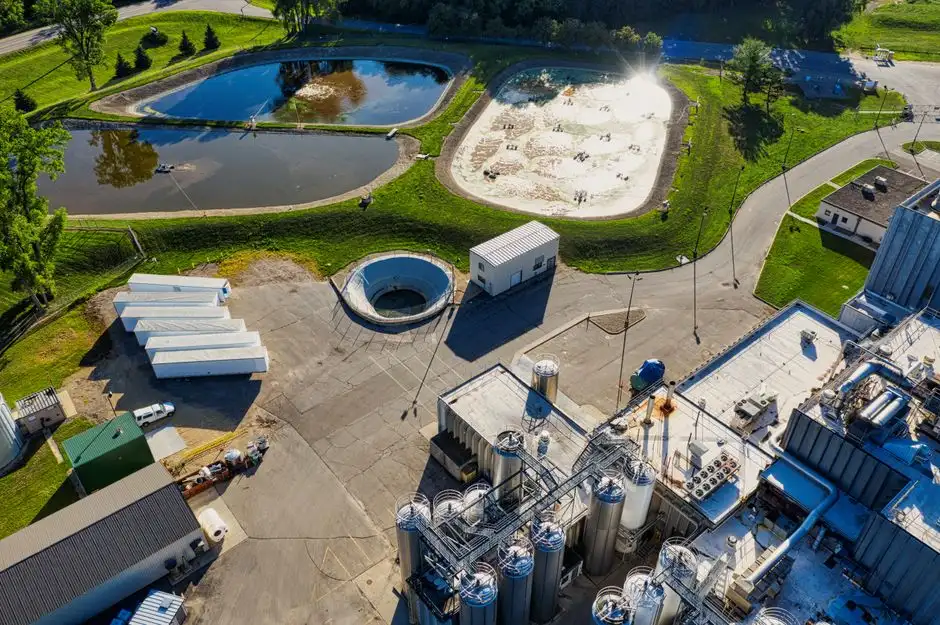
There are only two flowsheets that consistently meet discharge limits on snack effluent without paying for a third-party wastewater hauler: a strictly aerobic DAF→MBR train, and an anaerobic-fronted DAF→UASB/IC→MBR train. Both are technically proven; the decision is driven by flow rate, energy cost, and whether the plant can use biogas on-site.
| Stage | Train A: DAF + MBR (aerobic) | Train B: DAF + UASB/IC + MBR (anaerobic-aerobic) |
|---|---|---|
| FOG & TSS removal | DAF system for FOG and TSS removal targeting >90% FOG and >85% TSS | Same DAF upstream; protects anaerobic biomass from oil coating |
| Primary COD reduction | Aerobic MBR, 95%+ removal but no energy credit | UASB/IC achieves 70–85% COD reduction and produces biogas (0.30–0.45 m³ CH₄ per kg COD removed) |
| Polishing | MBR membrane bioreactor for snack food effluent polishing — effluent COD <50 mg/L, TSS <5 mg/L | Same MBR downstream; smaller footprint because anaerobic step absorbed the load |
| Disinfection | UV or ClO₂ to reach FOG and coliform limits | UV or ClO₂; lower fouling because MBR effluent is already low in organics |
| Footprint | ~60% smaller than conventional activated sludge for the same load | ~40% smaller than Train A; anaerobic reactor is tall, not wide |
| Minimum viable flow | As low as 20 m³/day | ~500 m³/day below which the UASB/IC heat-tracing and gas handling CAPEX does not pay back |
| Reference installation | Common in Asian snack plants with discharge-to-sewer constraints | Xylem/ADI anaerobic system at Shearer's Foods (Ohio), documented for high-strength snack effluent |
Train A wins on simplicity, faster installation (8–12 months vs 14–18), and lower upfront CAPEX for small or medium plants. Train B wins on lifecycle cost once flow clears the 500 m³/day threshold, because the captured biogas displaces 25–40% of fryer natural gas when piped back to the boiler.
2026 CAPEX and OPEX Benchmarks per m³/day
Budget conversations go off the rails when suppliers quote turnkey figures without the same scope definition. The benchmarks below cover a full containerized or skid-mounted system including equipment, installation, commissioning, and instrumentation — not just the bioreactor tank.
| Capacity band | Train A CAPEX (USD per m³/day) | Train B CAPEX (USD per m³/day) | Train A OPEX (USD per m³ treated) | Train B OPEX (USD per m³ treated, net of biogas credit) |
|---|---|---|---|---|
| 50–200 m³/day | $700–$900 | Not economic | $0.28–$0.42 | — |
| 200–500 m³/day | $500–$750 | $650–$950 (Train B premium 25–40%) | $0.22–$0.34 | $0.14–$0.24 |
| 500–1,000 m³/day | $400–$600 | $500–$780 | $0.18–$0.30 | $0.10–$0.20 |
| 1,000–2,000 m³/day | $280–$420 | $350–$650 | $0.18–$0.28 | $0.08–$0.16 |
OPEX splits typically as: electrical $0.06–$0.14/m³, polymer and coagulant dosing $0.04–$0.09/m³, sludge hauling $0.05–$0.12/m³, and direct labor $0.03–$0.07/m³. The sludge line is the easiest to underestimate: a 500 m³/day snack plant at 1.5% waste-activated sludge solids generates 18–25 m³/day of dewatered cake, which is why the dewatering choice is bolted into the OPEX assumption. A plate and frame filter press for snack plant sludge in the 1–125 m² filtration area range brings cake solids to 28–35% DS, which is the difference between paying a hauler for water and paying for actual dry solids. Anaerobic Train B at 1,000 m³/day with fryer-heat biogas utilization typically hits a 3–5 year simple payback versus Train A, but only if the biogas is metered and credited to the boiler fuel account from day one (HydropureWater field data, 2026).
7-Criterion Vendor Selection Matrix
Copy the table below into your RFQ. Score each vendor 1–5 per row, multiply by the weight, and drop any supplier scoring below 60/100 before the second round.
| # | Criterion | Weight | What to ask the vendor | Hard red flag |
|---|---|---|---|---|
| 1 | FOG removal guarantee (≥90% at 2,500 mg/L) | 20% | Pilot or operating data on FOG >1,500 mg/L | No pilot data on FOG >1,500 mg/L |
| 2 | COD compliance track record | 15% | Reference list with 12+ months of compliance lab data | No third-party lab certificates |
| 3 | Footprint and modularity | 10% | Skid-mounted vs containerized, expansion headroom | Custom civil-only design with no skid option |
| 4 | Energy recovery / OPEX model | 15% | Specific power (kWh/m³) and biogas yield (m³ CH₄/kg COD) | Vague "energy efficient" claim without numbers |
| 5 | Automation level (SCADA, remote monitoring) | 10% | Membrane cleaning sequences, alarm escalation, data export | PLC only, no HMI/SCADA quoted separately |
| 6 | Regional service & spare parts | 15% | Documented response time within 150 km of the plant | >72-hour on-site response commitment |
| 7 | Reference installations in snack / frozen-food plants | 15% | At least two running references in the same subsegment | No in-house MBR membrane supply (forces third-party warranty gaps) |
The "no in-house MBR membrane supply" line deserves its own paragraph: when a system integrator sources hollow-fiber or flat-sheet MBR modules from a third party, membrane warranty claims routinely take 6–10 weeks to resolve because the supplier has to escalate back to the membrane OEM. That gap is the single most common cause of MBR trains falling out of compliance during the first two years.
Regional Compliance Snapshot: U.S., EU, India, China, Southeast Asia
Multinational snack groups standardizing on one vendor need to know which compliance regime bites hardest. In the United States, EPA 40 CFR Part 405 sets the categorical F&B limits, and large snack plants need NPDES permits with self-monitoring obligations — see the wastewater self-monitoring reporting requirements guide for the 2026 reporting cadence. In the European Union, IED 2010/75/EU and the BAT-AEL tables drive stricter COD, BOD, and whole-effluent toxicity (WET) tests once a plant exceeds 4 t/day COD loading, which most 200+ m³/day snack lines do. India's CPCB and state PCBs enforce F&B-specific norms, while China's GB 8978-1996 remains the baseline for Class 1 discharge into municipal sewers. Thailand's PCD and Malaysia's DOE add country-specific schedules that frequently require continuous on-site monitoring for plants above 1,000 m³/day. Across all five regimes, the ancillaries that keep a plant compliant are a rotary bar screen (1–5 mm aperture) upstream of the DAF and a ClO₂ generator at the discharge — both are available as packaged units sized to snack-line flows, and both close the gap between "meets the standard" and "passes the audit."
Frequently Asked Questions
What COD range should a snack food wastewater treatment plant be sized for?
Design for 5,000–25,000 mg/L influent COD and verify with a two-week composite sampling campaign; kettle-cooked lines typically sit in the 15,000–25,000 range, while popcorn and tortilla lines run 5,000–10,000.
Is DAF enough to handle 2,000 mg/L FOG on its own?
No — a DAF unit consistently removes 85–95% of emulsified FOG when optimized, leaving 100–300 mg/L in the effluent; biological polishing downstream is required to reach the ≤10 mg/L discharge target under EPA 40 CFR Part 405.
When does anaerobic (UASB/IC) make sense for a snack plant?
Flow above 500 m³/day and access to a fryer or boiler heat loop for biogas utilization — at that point Train B reduces OPEX by 30–50% versus a DAF+MBR-only train and pays back in 3–5 years (HydropureWater field data, 2026).
How much footprint does an MBR save versus conventional activated sludge?
Approximately 60% smaller footprint for the same BOD load, because mixed liquor suspended solids operate at 8,000–12,000 mg/L versus 2,000–4,000 mg/L in a conventional aeration basin, which directly reduces tankage volume.
Which discharge standard applies to a snack plant in Ohio vs Guangdong?
Ohio plants discharging to a POTW follow U.S. EPA 40 CFR Part 405 categorical limits and local POTW pretreatment rules; Guangdong plants follow China GB 8978-1996 Class 1 limits with provincial addenda — the COD and FOG ceilings differ by roughly a factor of two between the two regimes.