Why California Hospital Wastewater Cannot Be Treated Like Municipal Sewage
Hospital effluent in California carries a pollutant fingerprint that domestic sewage simply does not — antibiotics, iodinated contrast media, chemotherapeutics, hormones, glutaraldehyde, radioisotopes from nuclear medicine, and PFAS from fluorinated surfactants used in diagnostics and sterilization. California processes roughly 4 billion gallons of wastewater per day across more than 900 plants and 100,000 miles of sewer (Water Education Foundation), yet a single 200-bed hospital generates 40,000–160,000 gal/day of effluent loaded with micropollutants at concentrations 10–1,000× higher than the surrounding municipal stream. Pharmaceuticals typically appear in hospital sewage at sub-µg/L to low mg/L levels, while bulk organics still measure in the 150–1,000 mg/L BOD/COD range — so a hospital stream looks "ordinary" on a BOD meter but carries a chemical load that municipal activated sludge was never optimized to break down. The State Water Resources Control Board (SWRCB) explicitly lists disposed pharmaceuticals and chemicals of emerging concern as priority state challenges, which is why source control and dedicated handling are now baseline expectations, not optional add-ons. On the federal side, EPA's categorical standard for hospitals under 40 CFR Part 444 caps existing-source discharges at BOD₅ 260 mg/L, TSS 60 mg/L, and pretreatment sources at BOD 50 mg/L daily maximum — limits that most POTWs in California enforce through local sewer use ordinances. For a design engineer, the practical takeaway is that tying a hospital drain directly into the sanitary sewer without engineered pretreatment is no longer defensible in 2026.
2026 California Regulatory Framework: Title 22, SWRCB, and EPA Layers
California hospital wastewater in 2026 sits at the intersection of three enforceable layers: California Title 22, SWRCB Waste Discharge Requirements (WDRs), and EPA categorical pretreatment standards. Title 22 Division 4 Chapter 3 (Water Recycling Criteria) governs any on-site reuse — disinfected tertiary recycled water must meet total coliform <2.2 MPN/100 mL, turbidity <2 NTU, and demonstrate 5-log virus reduction, with separate CNS reductions for subsurface irrigation. SWRCB issues site-specific WDRs through the nine Regional Water Quality Control Boards (RWQCBs) for any on-site discharge that does not enter a POTW, including groundwater recharge or surface discharge under an Order. At the federal level, 40 CFR Part 403 General Pretreatment Regulations apply to all indirect discharges, while 40 CFR Part 444 sets hospital-specific categorical limits that POTWs enforce. The 2024–2026 EPA PFAS National Primary Drinking Water Rule (MCL 4 ng/L PFOA, 10 ng/L PFOS, 10 ng/L PFHxS, 10 ng/L HFPO-DA) now drives monitoring for hospitals with on-site reuse, since PFAS in hospital effluent is increasingly measured at POTW headworks. Local POTW ordinances layer on top: LACSD restricts total residual chlorine to <0.1 mg/L at discharge, San Francisco PUC enforces strict mercury and pharmaceutical loadings, and Sacramento Regional County Sanitation District applies heavy metals and cyanide action levels. A defensible 2026 design satisfies all three layers simultaneously, not just the federal minimum.
| Regulatory Layer | Authority | Key 2026 Requirement | Engineering Implication |
|---|---|---|---|
| Title 22 Div. 4 Ch. 3 | CA SWRCB / DDW | Disinfected tertiary: total coliform <2.2 MPN/100 mL, turbidity <2 NTU | Multi-barrier disinfection + filtration required for any reuse |
| SWRCB WDRs / General Orders | RWQCBs (9 regions) | Site-specific flow, BOD/TSS, nitrogen limits, reuse end-use | Engineered submittal required for >5,000 gpd systems |
| 40 CFR Part 403 | EPA / POTW | General pretreatment — no pass-through, no interference | Equalization + flow/load monitoring mandatory |
| 40 CFR Part 444 | EPA categorical | BOD 50 mg/L, TSS 60 mg/L daily max (existing source) | MBR or equivalent biological step required |
| EPA PFAS NPDWR (2024) | EPA | PFOA 4 ng/L, PFOS 10 ng/L, PFHxS 10 ng/L | Activated carbon or RO polishing for reuse pathways |
| Local Sewer Use Ordinance | POTW (e.g., LACSD, SFPUC) | TRC <0.1 mg/L, heavy metals, pH 5.5–9.5, FOG caps | Dechlorination + pH control on all NaOCl systems |
Hospital Wastewater Characteristics vs. Domestic Sewage
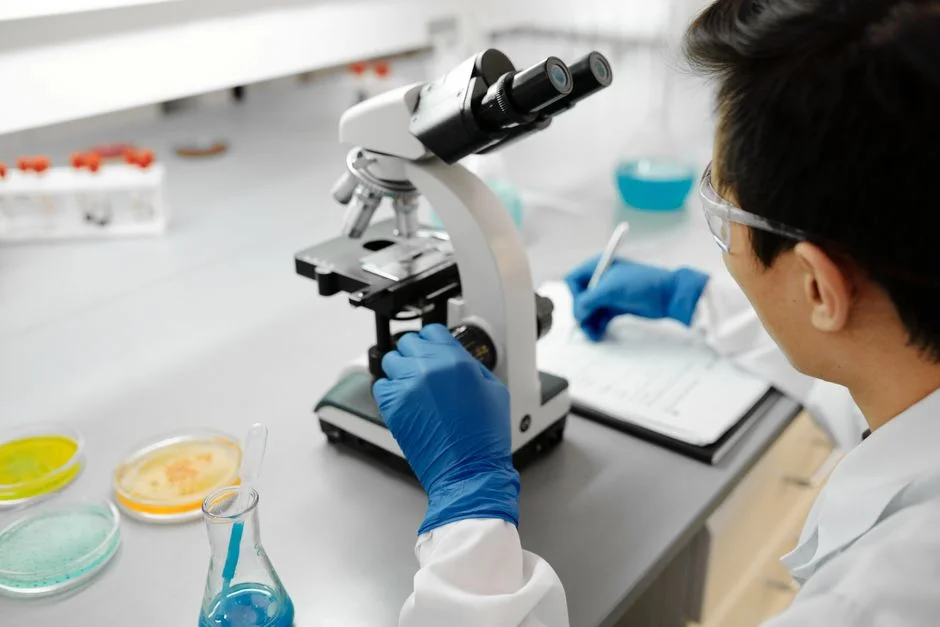
Hospital influent is comparable to domestic sewage in bulk organics but diverges sharply in micropollutants, pathogens, and pH variability. Typical hospital BOD runs 150–400 mg/L, COD 300–1,000 mg/L, and TSS 100–300 mg/L — overlapping the domestic baseline of BOD 200 mg/L, COD 400 mg/L, and TSS 220 mg/L. Where the streams diverge is in pharmaceutical concentration (sub-µg/L to mg/L, versus trace background in domestic), iodinated contrast media (up to mg/L during imaging peaks), and bacterial load (10⁶–10⁷ CFU/100 mL total coliforms, often including antibiotic-resistant organisms). Ammonia-nitrogen from laboratory and dialysis drainage runs 20–80 mg/L — comparable to strong domestic sewage — but FOG from kitchens and pathology labs can spike to 50–200 mg/L. pH swings are wider in hospital streams (5.5–9.0) due to sterilization chemicals, fixer/developer from radiology, and acid/alkaline cleaners from labs, versus the relatively stable 6.5–8.0 typical of domestic sewage. Flow patterns also differ: hospitals peak at 1.2–2.0× average during shift changes and imaging hours, while domestic sewage averages a 1.5 peaking factor across the diurnal curve. Designers should baseline against the high end of these ranges, then verify with at least one week of composite sampling before finalizing tank volumes.
| Parameter | Hospital Influent (typical range) | Domestic Sewage (typical) | Design Note |
|---|---|---|---|
| BOD₅ | 150–400 mg/L | ~200 mg/L | Use 350 mg/L for safety factor |
| COD | 300–1,000 mg/L | ~400 mg/L | BOD/COD ratio often 0.4–0.5 |
| TSS | 100–300 mg/L | ~220 mg/L | Spikes from laundry and surgical waste |
| NH₃-N | 20–80 mg/L | 20–35 mg/L | Dialysis and lab waste drive peaks |
| FOG | 50–200 mg/L | 50–100 mg/L | DAF pretreatment recommended above 100 mg/L |
| pH | 5.5–9.0 | 6.5–8.0 | Equalization required for lab drainage |
| Total coliforms | 10⁶–10⁷ CFU/100 mL | 10⁶–10⁷ CFU/100 mL | Log-kill targets drive disinfection dose |
| Pharmaceuticals (sum) | Sub-µg/L to mg/L | Trace background | 10–1,000× higher than domestic |
| Flow peaking factor | 1.2–2.0 | ~1.5 | Size equalization to 4–8 hr HRT |
2026 Process Train: Pretreatment, Biological, Disinfection, and Reuse Polishing
A 2026-compliant California hospital process train runs in five steps: screening and equalization, primary/chemical separation, biological treatment, disinfection, and optional reuse polishing. Pretreatment starts with a rotary mechanical bar screen at 3–6 mm aperture to remove wipes, gauze, and plastics that would otherwise blind downstream membranes, followed by a 4–8 hour HRT equalization tank to dampen flow and load spikes. A DAF pre-treatment system ahead of biology cuts TSS 92–97% and FOG 95%+, protecting membranes from fouling. The biological step typically uses an MBR membrane bioreactor system with submerged PVDF membranes at 0.1 µm nominal pore size — MBR delivers effluent COD <50 mg/L and TSS <5 mg/L in roughly 60% of the footprint of conventional activated sludge, while removing ~60% of the bulk micro-organic load through combined biosorption and biodegradation. For pharmaceuticals that MBR does not fully oxidize, advanced oxidation (ozone or ozone/H₂O₂) is added before disinfection. Disinfection in 2026 defaults to ozone at 5–15 mg/L dose with 10–30 min contact, achieving 99.9% coliform kill and meaningful oxidation of recalcitrant APIs, or ClO₂ at 1–3 mg/L where THM formation must be avoided. For hospitals pursuing on-site Title 22 reuse, an RO polishing step at 75–85% recovery brings TDS <500 mg/L; reject brine (15–25% of feed) requires evaporation or off-site haul. The full train integrates well as a compact medical wastewater treatment system for sub-200-bed facilities, and a parallel comparison to Chicago-area hospital design is available in this hospital wastewater treatment in Chicago engineering reference.
| Step | Unit Operation | Design Parameter | Performance Target |
|---|---|---|---|
| 1. Screening | Rotary bar screen | 3–6 mm aperture | Solids removal, membrane protection |
| 2. Equalization | EQ tank, 4–8 hr HRT | pH 5.5–9.0, flow dampening | Stable downstream loading |
| 3. Primary/Chemical | DAF or lamella clarifier | Polymer 2–5 mg/L, air:solids 0.03 | TSS 92–97%, FOG 95%+ removal |
| 4. Biological | MBR (PVDF, 0.1 µm) | MLSS 8,000–12,000 mg/L, HRT 6–10 hr | COD <50 mg/L, TSS <5 mg/L, ~60% micro-organic |
| 5. Disinfection | Ozone / ClO₂ / UV | O₃ 5–15 mg/L, ClO₂ 1–3 mg/L, UV 30–40 mJ/cm² | 99.9% coliform kill, pharma oxidation |
| 6. Reuse Polishing | RO (optional) | 75–85% recovery | TDS <500 mg/L, PFAS <10 ng/L |
Disinfection Comparison for California Hospital Effluent: Ozone, ClO₂, UV, and Sodium Hypochlorite
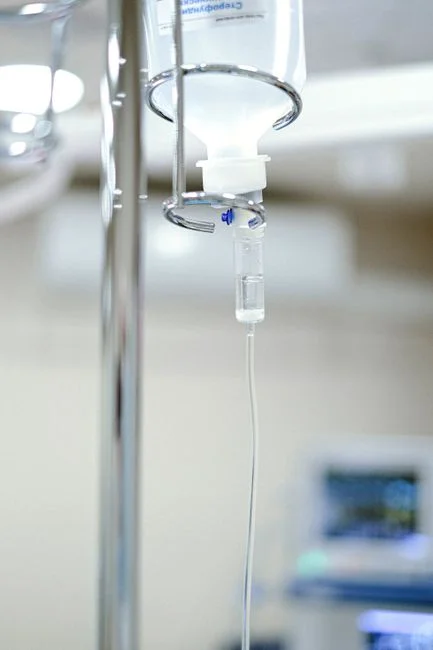
Disinfection selection in California is shaped as much by POTW discharge rules as by pathogen kill. Ozone delivers the best pharmaceutical oxidation (40–90% removal of most APIs) and leaves no residual — a strong fit for hospital streams — but requires capital for generation and off-gas destruction. ClO₂ offers broad-spectrum kill without THM formation and is EPA- and WHO-compliant for healthcare effluent; an EPA/WHO-compliant ClO2 generator rated from 50 g/h to 20,000 g/h handles flows from 50-bed clinics to 800-bed hospitals. UV is chemical-free and compact but underperforms in turbid or high-ammonia streams, so it works as a polishing step rather than a primary barrier. Sodium hypochlorite remains the lowest-capex option but forms trihalomethanes and is restricted by most California POTWs (LACSD caps total residual chlorine at <0.1 mg/L), forcing a dechlorination stage with bisulfite and additional O&M. The 2026 default for California hospital installations is ClO₂ or ozone for primary disinfection, with UV polishing where Title 22 reuse demands redundant barriers.
| Disinfection | Dose | Pathogen Kill | Pharma Oxidation | Residual / THM | California POTW Fit |
|---|---|---|---|---|---|
| Ozone | 5–15 mg/L, 10–30 min | >99.9% coliform, 99% virus | High (40–90% API removal) | No residual, no THM | Excellent — no dechlorination needed |
| Chlorine Dioxide (ClO₂) | 1–3 mg/L | >99.9% coliform, 99.9% virus | Moderate (selected APIs) | No THM, low ClO₂⁻ residual | Excellent — EPA/WHO accepted |
| UV (254 nm) | 30–40 mJ/cm² | >99.9% coliform if turbidity <2 NTU | None (photolysis only) | No chemical residual | Good as polishing step |
| Sodium Hypochlorite | 5–10 mg/L free Cl₂ | >99.9% coliform | Low (oxidation only) | Forms THMs, residual Cl₂ | Restricted — TRC <0.1 mg/L, dechlor required |
Process Selection Matrix: Matching Hospital Size to Treatment Configuration
Hospital size and discharge pathway drive equipment selection more than any other factor. Sub-50-bed clinics typically install a skid-mounted or containerized compact medical wastewater treatment system with screening, MBR, and ozone-only disinfection, occupying roughly 0.5–2 m² of floor area and delivering 99%+ pathogen kill at 0.5–2 m³/day flow. 50–200 bed hospitals generally need an MBR + ClO₂ package in a containerized or modular layout, sized for 5–20 m³/day. 200–500 bed facilities add RO polishing for on-site Title 22 reuse (irrigation, cooling tower makeup), and >500-bed hospitals require fully engineered MBR with tertiary treatment, redundant disinfection, and a PFAS removal technology 2026 outlook-compliant polishing step. Discharge pathway matters: sanitary sewer to POTW needs only 40 CFR Part 444 compliance; on-site Title 22 reuse adds disinfected tertiary limits (turbidity <2 NTU, coliform <2.2 MPN/100 mL); surface discharge under WDRs requires the most stringent effluent quality. California installations below 5,000 gpd can typically be permitted as package systems through the local RWQCB, while larger systems require full engineering submittal. CAPEX ranges in 2026 run from $180,000 for a small clinic skid to $2.5M for a 500+ bed custom engineered system, with OPEX of $0.40–$0.85 per liter treated driven mainly by membrane replacement, ozone power, and sludge hauling. For a broader U.S. context on package plant selection, this U.S. municipal sewage treatment plant compliance reference covers parallel decision logic, and MBR market growth 2026 data confirms the dominance of MBR in new California hospital builds.
| Hospital Size | Typical Flow | Recommended Configuration | Disinfection | 2026 CAPEX (USD) |
|---|---|---|---|---|
| <50 beds (clinic) | 0.5–2 m³/day | Skid: screen + EQ + MBR + ozone | Ozone 5–10 mg/L | $180,000–$350,000 |
| 50–200 beds | 5–20 m³/day | Containerized MBR + ClO₂ | ClO₂ 1–3 mg/L | $400,000–$900,000 |
| 200–500 beds | 20–60 m³/day | Full MBR + RO for reuse | ClO₂ + UV polish | $1.0M–$1.8M |
| >500 beds | 60–200 m³/day | Custom MBR + tertiary + GAC/RO | Ozone + UV redundant | $1.8M–$2.5M |
Frequently Asked Questions
Does California require hospitals to treat wastewater on-site?
No state statute mandates on-site treatment, but EPA categorical standards under 40 CFR Part 444 and local POTW sewer use ordinances effectively require engineered pretreatment for any hospital discharging to a sanitary sewer (per EPA 40 CFR Part 444).
What is the best treatment process for hospital wastewater in California?
An MBR with ozone or ClO₂ disinfection is the 2026 default, achieving effluent COD <50 mg/L, TSS <5 mg/L, and >99.9% pathogen kill while oxidizing 40–90% of pharmaceutical load (HydropureWater field data, 2026).
How much does hospital wastewater treatment cost in California in 2026?
CAPEX ranges from $180,000 for a sub-50-bed clinic skid to $2.5M for a 500+ bed custom engineered system, with OPEX of $0.40–$0.85 per liter treated (HydropureWater field data, 2026).
Can treated hospital wastewater be reused in California?
Yes, under Title 22 Division 4 Chapter 3 Water Recycling Criteria, with disinfected tertiary standards (turbidity <2 NTU, total coliform <2.2 MPN/100 mL) and 5-log virus reduction (per Title 22).