MBR Operating Cost Breakdown: What the Bill Includes
Industrial MBR plants in 2026 typically run $0.18–$0.45 per m³ treated. An MBR operating cost breakdown splits that bill into five line items: aeration energy (45–60%), membrane replacement (15–20%), cleaning chemicals (5–8%), sludge handling (8–12%), and labor/maintenance (10–15%). Submerged PVDF flat-sheet trains with intermittent aeration often land near $0.18–$0.22/m³ (HydropureWater field data, 2026).
The MSD/MWD 2022 feasibility study set a baseline of $0.22/m³ for a California-scale facility assuming $0.23/kWh power. Escalating that to 2026 with ~8–10% cumulative energy inflation and 3–4% chemical CPI pushes the same physical plant toward $0.26–$0.28/m³ before any efficiency retrofits. Operators comparing vendor quotes should anchor every line to one of five buckets. Map spend to aeration energy, membrane replacement and CIP chemicals, sludge dewatering and disposal, preventive maintenance and spares, or labor and instrumentation. Anything outside those buckets is usually capex financing or hidden overhead that should be questioned.
Submerged MBRs have a fundamentally different OPEX shape than external/side-stream designs. Flat-sheet PVDF modules in an MBR Membrane Bioreactor Wastewater Treatment System use 10–20× less energy than cross-flow designs. No high-flow recirculation pump is required because the membrane sits directly in the aeration tank. Industrial influent (high COD/TDS/fats) raises aeration demand by 20–40% versus municipal wastewater and increases CIP frequency. A per-m³ number from a municipal reference plant should never be lifted directly into an industrial TCO model. Teams still weighing membrane versus conventional ASP should also review the mbr vs. cas: capital and operating cost evaluation before locking a technology path.
| OPEX Line Item | Typical % of Total OPEX | 2026 Industrial Range ($/m³) | Primary Design Lever |
|---|---|---|---|
| Aeration energy | 45–60% | $0.05–$0.20 | Blower efficiency, DO control strategy |
| Membrane replacement | 15–20% | $0.03–$0.07 | Module type, CIP discipline |
| CIP chemicals | 5–8% | $0.008–$0.025 | Influent FOG/hardness, recovery CIP |
| Sludge handling | 8–12% | $0.015–$0.04 | MLSS control, dewatering equipment |
| Labor & maintenance | 10–15% | $0.02–$0.05 | Automation level, sensor coverage |
Energy Cost: Why Aeration Dominates the Bill
Aeration consumes 0.6–1.2 kWh/m³ in industrial MBRs versus 0.3–0.5 kWh/m³ in conventional activated sludge. The membrane tank adds continuous scouring air at 0.05–0.15 m³ air per m³ permeate on top of biological oxygen demand. At electricity rates of $0.08–$0.23/kWh, aeration alone accounts for $0.05–$0.20/m³. The MSD/MWD 2022 study assumed $0.23/kWh; many EU industrial rates run higher while Chinese industrial rates run lower. Aeration remains the single largest line item on every MBR plant's utility bill.
The two engineering decisions that move this number most are DO setpoint strategy and blower selection. Intermittent aeration for membrane scouring (e.g., 10 s on / 10 s off) versus continuous aeration cuts energy 25–35% with no measurable flux loss for flat-sheet modules. Flat-sheet geometry is less dependent on constant crossflow than hollow-fiber. A high-efficiency turbo blower at 70% isentropic efficiency versus a lobe blower at 50% saves ~$8K–$15K/yr on a 1,000 m³/day plant (HydropureWater field data, 2026). Payback is under 18 months at industrial electricity rates above $0.10/kWh.
Operators who still run fixed DO setpoints at 2.0 mg/L are leaving 20–30% of their aeration spend on the table. Ammonia-based aeration control (DO tied to NH₃-N loading rather than a static value) consistently delivers 15–25% additional savings without violating effluent ammonia limits. The controller only pushes air when nitrification demand exists, instead of holding a constant aerobic reserve. Most plants we size for industrial COD loads run DO closer to 1.0–1.5 mg/L once ammonia feedback is tuned.
Membrane Replacement: The 5–8 Year Capital Event Inside OPEX
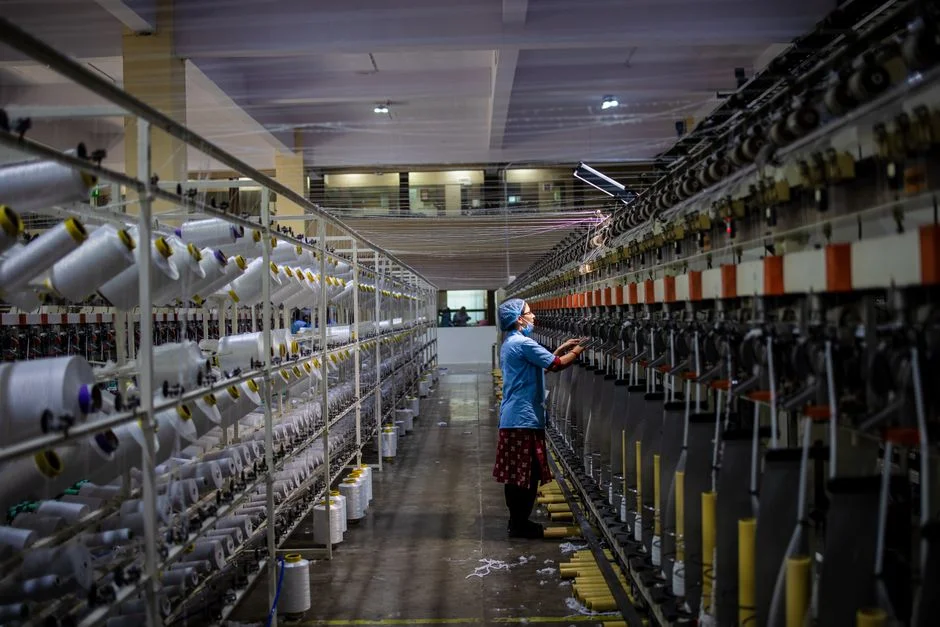
PVDF flat-sheet membrane modules cost $80–$140/m² installed. A 1,000 m³/day plant with a design flux of 15–20 LMH needs roughly 800–1,200 m² of membrane area. Service life runs 5–8 years with proper CIP versus 3–4 years with neglect, translating to $0.03–$0.07/m³ amortized. That cross-checks against the MSD/MWD $39,600–$52,800/yr membrane replacement line for a comparable 1 MGD California plant (2022 dollars).
Hollow-fiber membranes are 20–30% cheaper per m² upfront but suffer more irreversible fouling and breakages. Actual service life often falls to 3–5 years. The net annualized cost is usually within 10% of flat-sheet, but the risk profile is worse. A single broken fiber can drop a cassette, and replacement is more labor-intensive per m² than swapping flat-sheet cassettes. Operators modeling 5-year TCO should compare lifecycle cost, not purchase price, when evaluating module geometry.
Spare-module inventory policy matters more than most procurement teams realize. Keep 5–10% of installed area as on-site spares. Emergency procurement premiums run 30–60% above scheduled replacement pricing, and a 6-week lead time during a fouling crisis can put a plant in discharge violation. The DF series PVDF flat-sheet membrane modules are designed for cassette-level swap. A single operator can replace a fouled cassette in under 4 hours without lifting the tank.
Cleaning Chemicals, Sludge Handling, and Labor: The Hidden 30%
The three buckets that procurement usually underestimates together account for 23–35% of total OPEX, and each is highly sensitive to influent characteristics. CIP chemicals break into two categories. Use NaOCl at 300–500 mg/L free chlorine for organic fouling, and citric acid at 1–2% w/w for inorganic scaling. Annualized cost runs $0.008–$0.025/m³ depending on influent hardness and FOG load. A dairy or edible-oil plant sits at the high end; a pharmaceutical plant with soft water sits at the low end. An automatic chemical dosing system with conductivity-trended injection cuts chemical waste from overdosing by 10–20% versus manual dosing.
Waste activated sludge from MBR runs 8,000–12,000 mg/L MLSS, much thicker than conventional ASP at 2,000–4,000 mg/L. This cuts sludge volume to haul by 40–60% and reduces dewatering chemical dose (polymer) because the solids are already pre-thickened. A plate-and-frame filter press handles this concentration range well. It produces cake at 22–28% dry solids versus 18–22% for a belt press on thinner feed. Sludge disposal runs $20–$80/ton dewatered cake depending on jurisdiction. For a 1,000 m³/day plant at typical 0.3–0.5 kg TSS/m³ removed, expect 1.5–3.0 tons/day of cake.
Labor runs 0.5–1.5 operator-hours per 100 m³/day treated for fully automated MBR with PLC monitoring. Instrument air, permeate pumps, and CIP skids should be alarm-monitored rather than manually attended. A well-tuned MBR with online TMP sensors, permeability trending, and automated CIP triggers typically runs 30–50% less operator attention than a manually-logged plant. Underestimating labor at the proposal stage is one of the most common ways industrial MBR OPEX projections fall short in years 2 and 3.
What Is MBR Cost in € per m³/day?
MBR estimated cost in € per m³/day is not a single published tariff. Start from the same $0.18–$0.45/m³ OPEX band and convert at the plant's local FX rate, power tariff, and chemical list prices. Capex for the same train is quoted separately in € per m³/d of installed capacity and should never be mixed into the OPEX line. European fab and pharmaceutical sites often sit above the midpoint of the band because industrial power can exceed $0.15/kWh and CIP logistics markups are higher than municipal Chinese reference cases.
A water treatment plant cost breakdown for EU fabs therefore weights aeration harder than a low-tariff municipal reference. If your steering committee asks for “€ per m³/d,” clarify whether they mean installed capex intensity or daily OPEX — those are different units and different decisions.
What Does an MBR Cost for 50 Homes?
An MBR for about 50 homes is a small package plant, far below the 1,000 m³/day industrial reference used in the OPEX table. Apply the same $0.18–$0.45/m³ band to the site's measured daily flow rather than inventing a household tariff. Small trains lose scale efficiency versus a 1,000 m³/day plant, so labor and spare-module premiums often push real OPEX toward the upper half of the band. Most plants we size in this class still use submerged flat-sheet modules. Cassette swaps stay within a single-operator window and avoid the recirculation energy of side-stream designs.
A 2026 Cost-Control Checklist: 7 Levers That Cut OPEX 20–40%
Every line item in the OPEX table is controllable, but not every lever has the same payback. The checklist below ranks interventions by cost-to-implement and typical savings. A maintenance team can sequence the first three items without a capex committee. Use this MBR operating cost breakdown as the baseline when you assign savings to each lever.
- Switch membrane-tank DO control from fixed setpoint to intermittent cycling — 25–35% aeration energy reduction, payback 6–14 months, no hardware change required.
- Implement recovery CIP — reuse NaOCl backwash as pre-aeration-tank oxidant; cuts chemical spend 15–25%.
- Install online TMP and permeability sensors — predictive cleaning cuts irreversible fouling events 40–60%, extending membrane life by 1–2 years.
- Right-size sludge wasting — target F/M 0.05–0.10 kg BOD/kg MLVSS·d; over-aeration to compensate for poor wasting is one of the most common OPEX leaks.
- Retrofit lobe blowers to high-efficiency turbo blowers — 20–30% specific power reduction, 14–24 month payback at $0.12+/kWh.
- Negotiate membrane replacement as a multi-year framework agreement — locks 2026 pricing for 2027/2028 replacements, avoids 30–60% emergency premiums.
- Bundle instrument air and CIP skid controls into a single PLC with alarm escalation — reduces operator-hours per 100 m³ by 20–40%.
Sequence these in three phases: no-capex controls (months 0–3), sensor upgrades (months 3–9), blower retrofit (years 1–2). A 1,000 m³/day plant that executes all seven typically lands at $0.20–$0.24/m³ within 18 months. That is a 25–35% reduction from a typical 2022 baseline. For a deeper TCO framework that ties OPEX levers to capex decisions, see the 2026 TCO breakdown for wastewater plants.
| Lever | Capex Tier | OPEX Reduction | Payback |
|---|---|---|---|
| Intermittent DO cycling | None | 25–35% on aeration | 6–14 months |
| Recovery CIP | Low | 15–25% on chemicals | 9–18 months |
| Online TMP sensors | Medium | 40–60% fewer fouling events | 12–24 months |
| Sludge wasting optimization | None | 5–10% on total OPEX | Immediate |
| Turbo blower retrofit | High | 20–30% on aeration | 14–24 months |
| Multi-year membrane contract | None | 30–60% on emergency premium | Immediate |
| PLC consolidation | Medium | 20–40% on labor | 18–36 months |
MBR vs MABR vs SBR: 2026 OPEX Benchmark Comparison
When defending a technology choice to a steering committee, OPEX alone is not enough. Effluent quality and footprint also determine whether the system fits the discharge permit and the site. The three technologies most often compared for industrial applications in 2026 are summarized below.
| Parameter | MBR (submerged PVDF) | MABR | SBR |
|---|---|---|---|
| 2026 OPEX range ($/m³) | $0.18–$0.45 | $0.15–$0.25 | $0.12–$0.28 |
| Energy intensity | 0.6–1.2 kWh/m³ | 0.25–0.55 kWh/m³ | 0.4–0.8 kWh/m³ |
| Effluent TSS (mg/L) | <5 | 10–30 | 10–25 |
| Effluent turbidity (NTU) | <1 | 5–15 | 5–20 |
| Footprint vs CAS | ~40% | ~50% | ~80% |
| Reuse-grade effluent | Yes | No (tertiary needed) | No (tertiary needed) |
The decision rule is straightforward. Choose MBR when reuse discharge is required or land is constrained. Choose MABR when BOD/COD removal is the only target and reuse is optional, because its 40–55% lower energy intensity compounds into real savings over 10+ years. Choose SBR only when capex is the binding constraint and batch operation is operationally acceptable. For a deeper MABR side-by-side including capex and lifecycle numbers, see the MABR vs MBR 2026 OPEX comparison. Discharge and reuse targets also depend on the MBR effluent quality and discharge compliance data.
Who This Is For / Next Step
This page is for plant engineers, EPC estimators, and procurement managers building a defensible OPEX model for industrial or municipal MBR trains. Look elsewhere if you only need a high-level CAPEX quote with no operating assumptions, or if your permit already locks a non-membrane process. Share your influent COD, design flow (m³/d), power tariff, and reuse target via our request a quote form. The five-bucket model can then be sized to your site.
Frequently Asked Questions
What is a typical MBR operating cost per cubic meter in 2026?
Industrial MBR plants in 2026 run $0.18–$0.45/m³ across the five OPEX buckets. Submerged PVDF flat-sheet systems cluster at the low end ($0.18–$0.22/m³); side-stream or hollow-fiber designs sit at the high end ($0.30–$0.45/m³). Power tariff and CIP frequency usually decide where a given site lands inside that band.
What is the single biggest OPEX lever in an MBR plant?
Aeration blower selection and DO control strategy dominate the bill. Switching from continuous to intermittent aeration cuts energy 25–35%. A turbo blower at 70% isentropic efficiency versus a lobe blower at 50% saves another 20–30% on the same line. Combined impact is about $0.04–$0.08/m³ under typical industrial tariffs.
How often do MBR membranes need replacement?
PVDF flat-sheet modules last 5–8 years with disciplined CIP, amortizing to $0.03–$0.07/m³. Hollow-fiber modules typically last 3–5 years due to fouling and breakage. Emergency replacement carries a 30–60% premium over scheduled pricing. Keep 5–10% spare area on site to avoid that premium.
When should an operator choose MBR over MABR?
Choose MBR when reuse-grade effluent (<5 mg/L TSS, <1 NTU turbidity) is required or when land area is constrained. MABR wins on energy — 40–55% lower than MBR — but its effluent typically needs tertiary filtration to reach reuse standards. That tertiary step erodes the OPEX advantage over a full lifecycle.
What does sludge disposal cost for an MBR plant?
Dewatered cake disposal runs $20–$80/ton depending on jurisdiction. A 1,000 m³/day MBR plant producing 1.5–3.0 tons/day of cake spends $11K–$88K/yr on disposal. That is why MLSS control and a properly sized plate-and-frame press matter as much as the membrane choice itself for long-run OPEX.