What Actually Drives Ultrafiltration System Maintenance Cost
Industrial ultrafiltration system maintenance cost in 2026 typically runs $0.04–$0.12 per cubic meter of permeate for routine upkeep, or $14,600–$43,800 per year for a 1,000 m³/day plant. The biggest swing factor is feed-water quality: high-TSS or oily feeds can push annual maintenance 2–4× higher than clean surface water, driven mainly by membrane replacement every 3–5 years and CIP chemicals.
Maintenance on a hollow-fiber UF skid breaks into four cost buckets that any finance director will recognize on a P&L:
- Membrane replacement — the single largest non-routine line, hit every 3–5 years on clean feeds and every 1.5–3 years on oily or high-TSS industrial feeds.
- CIP chemicals + rinse water — alkaline/acid/oxidant sequence per cycle, with frequency driven by fouling rate.
- Energy for feed and backwash pumps — bounded by the 2–5 bar operating window (per Morui/Formulatrix), so this bucket is the most predictable.
- Labor + integrity testing — operator hours per CIP, plus weekly pressure-decay or bubble-point tests on potable/reuse service.
The AGS-UF benchmark study is the cleanest public data point: total OPEX €0.223/m³, with membrane-related maintenance at roughly $0.026/m³ (assumed 1.5% of CAPEX per year). That means routine membrane upkeep is only about 12% of total OPEX — the rest is energy, chemicals, labor, and capital recovery. The takeaway for a 2026 budget defense: do not price "maintenance" as one line item. Membrane replacement at end-of-life is a separate, lumpy event that will distort any smooth OPEX forecast if it is buried inside routine upkeep. For a CAPEX anchor, Morui's $0.20–$0.33 per GPD daily-capacity cost on a 1,000,000 GPD system (~3,785 m³/day) translates to roughly $53,000–$87,000 per m³/day of installed capacity — the denominator you use to back-calculate the 1.5%/yr maintenance assumption on your own plant. If your skid feeds a downstream RO polishing stage, the RO will inherit any UF maintenance miss — integrity failures upstream translate directly into fouling and higher CIP frequency on the RO.
| Cost bucket | Typical 2026 range ($/m³ permeate) | Annual $ for 1,000 m³/day plant (365,000 m³/yr) | What drives it |
|---|---|---|---|
| Membrane replacement (amortized) | $0.015–$0.080 | $5,500–$29,000 | Module price × area ÷ service life |
| CIP chemicals + rinse water | $0.005–$0.025 | $1,800–$9,100 | Fouling rate, dosing, frequency |
| Energy (feed + backwash pumps) | $0.012–$0.048 | $4,400–$17,500 | 2–5 bar operating pressure, tariff |
| Labor + integrity testing | $0.008–$0.020 | $2,900–$7,300 | CIP cycles/yr, FTE allocation, test cadence |
| Total routine maintenance | $0.04–$0.17 | $14,600–$62,000 | Feed quality is the dominant lever |
How Feed-Water Quality Multiplies Your Maintenance Bill
Feed-water quality is the single buyer-side variable that shifts UF maintenance cost by 2–4× at the same flow rate — and it is the number most plant managers under-specify when they budget. The AGS-UF €0.223/m³ figure assumes a municipal-grade feed. Push TSS above 50 mg/L, add free oil, or let hardness climb past 300 mg/L as CaCO₃, and every cost bucket moves — but not in the same direction or at the same rate.
| Feed type | TSS / oil typical | CIP frequency | Membrane life | Maintenance cost ($/m³) |
|---|---|---|---|---|
| Pre-treated surface water / clarified effluent | <10 mg/L TSS, no oil | Every 2–4 weeks | 4–5 years | $0.04–$0.07 |
| Treated secondary effluent (post-clarifier) | 10–30 mg/L TSS, trace oil | Every 1–2 weeks | 3–4 years | $0.06–$0.10 |
| Oily industrial wastewater (food, metalworking, textile) | 30–100 mg/L TSS, 10–50 mg/L oil & grease | Every 2–5 days | 1.5–3 years | $0.10–$0.20 |
| High-TSS raw industrial feed (no pre-treatment) | >100 mg/L TSS, variable oil | Daily or CEB-mode | 1–2 years | $0.18–$0.35 |
Two diagnostic points to lock in before you trust any budget number: (1) the UF operating pressure window of 2–5 bar (per Morui and Formulatrix) caps energy OPEX even when fouling is severe, because the pumps cannot push past that band without redesigning the skid — so the cost penalty for a bad feed shows up in chemicals and membrane replacement, not in the electricity bill. (2) On oily feeds, install a DAF pre-treatment stage to drop oil/grease below 10 mg/L before the UF; this is the cheapest way to push a feed from the $0.15–$0.20/m³ band back into the $0.07–$0.10/m³ band. Without it, you are paying for membrane replacement on a 1.5-year cycle instead of a 4-year cycle — a roughly 2.5× cost swing on the same skid.
Membrane Replacement: The Cost No One Prices In Early Enough
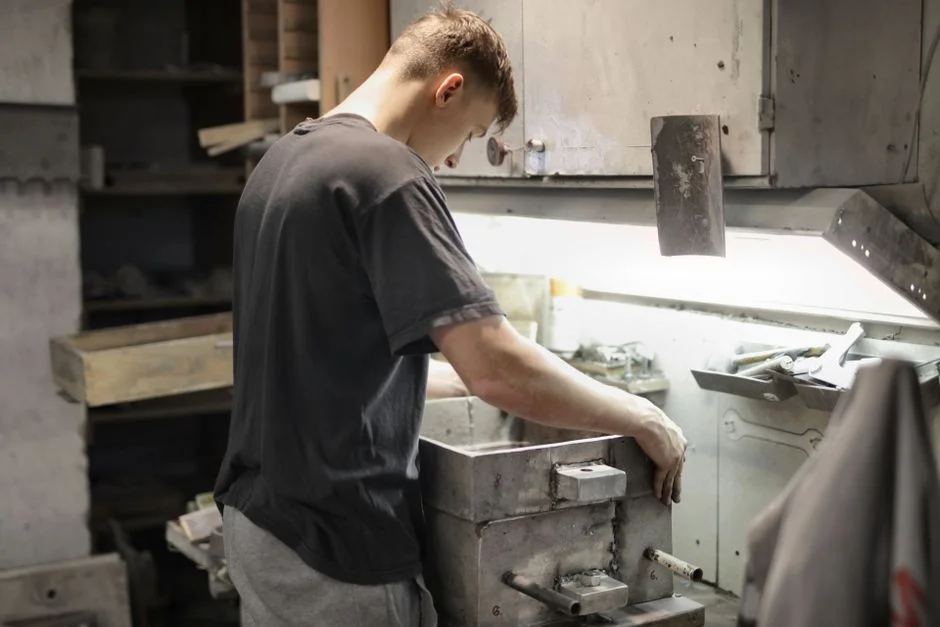
Hollow-fiber PES and PVDF UF modules for industrial service land in a band of $80–$220 per m² of membrane area, with the spread driven by brand, nominal pore size (0.01–0.1 µm), and module pressure rating. A 1,000 m³/day UF skid running at a typical design flux of 50–80 LMH carries roughly 500–700 m² of membrane area; at the $120/m² mid-range, a full replacement cycle is ~$60,000–$84,000 — about 30–45% of the original membrane CAPEX (per Morui's $53,000–$87,000 per m³/day installed-cost anchor). The replacement is rarely a one-time capex event for the CFO because it is a recurring bill — the question is just how often.
Two diagnostic triggers should authorize a replacement order, and both should be logged in your maintenance system:
- Sustained flux decline >20% at constant TMP — measured against the clean-water permeability baseline at commissioning. If you cannot recover baseline permeability after a full CIP sequence (alkaline + acid + oxidant), the fiber surface or pores are permanently fouled.
- Integrity test failure — pressure decay above the manufacturer limit (typically <0.1 bar/10 min on pressurized modules) or a bubble-point / diffusive flow failure on a potable/reuse system. This is non-negotiable on drinking-water or reuse service and usually means one or more fibers have failed.
Refurbishment sits between CIP and replacement. An aggressive chemical clean — extended soak in 1% NaOH + 500 ppm NaOCl at 35–40 °C — can recover 80–95% of clean-water permeability and extend useful life by 6–18 months at roughly $0.005–$0.015 per m² per cycle in chemical cost. The economic break-even is straightforward: if a full replacement is $72,000 and a deep refurbishment is ~$3,000–$6,000 in chemicals plus 16–24 hours of labor, refurbishment wins whenever it buys you at least one more year of service. It loses when integrity tests have already failed — no chemical clean will seal a broken fiber. For plants running flat-sheet PVDF flat-sheet UF/MBR membrane modules on tough industrial feeds, the same replacement math applies but the modules are easier to swap in cassettes, which typically halves the labor line.
CIP Chemicals, Energy, and Labor: The Steady-State Burn
The steady-state cost of running UF is the part of the budget that does not depend on whether you replaced membranes this year — it is the monthly burn. For a plant defending a 2026 budget, this is the number finance will track against actuals every quarter.
CIP chemicals. A standard sequence is alkaline (NaOH 0.5–1%) followed by acid (citric 1–2% or HCl 0.5%) and an oxidant step (NaOCl 200–500 ppm). Chemical cost on a clean surface-water feed lands at $0.005–$0.010/m³ of permeate and climbs to $0.015–$0.025/m³ on oily or high-fouling feeds that need more frequent cycling. The single biggest mistake here is dosing by time rather than by conductivity or pH endpoint — it wastes 15–30% of chemical and is the kind of line item a good automated CIP chemical dosing skid eliminates in the first quarter after install.
Energy. UF runs at 2–5 bar feed pressure, which is the structural reason it stays cheap versus RO. Expect 0.15–0.4 kWh per m³ of permeate for the feed pump plus backwash and CEB pumps. At an industrial tariff of $0.08–$0.12/kWh, the energy bucket is $0.012–$0.048/m³. Morui's $25,000–$150,000 annual electricity range for medium plants is consistent with a 1,000 m³/day skid at 0.25 kWh/m³ and a 12-month duty cycle. Energy is the most stable line in the budget — assume ±10% variance year to year.
Labor + integrity testing. Budget 2–6 hours per CIP cycle for an operator to rig, monitor, and rinse the skid, plus a monthly integrity test on potable/reuse service (pressure decay or bubble-point, per typical water-reuse standards such as the EPA 2017 membrane filtration guidance and most state drinking-water primacy agency rules). A 1,000 m³/day plant typically runs 0.5–1.0 FTE-equivalents dedicated to UF CIP and testing, depending on skid count. At a fully loaded $35–$55/hr, this is $0.008–$0.020/m³. The integrity test is the line that gets cut first when staffing gets tight — do not let it. A single failed fiber that ships downstream undetected will cost more in one RO CIP than a year of weekly pressure-decay tests.
5-Year Maintenance Cost Model for a 1,000 m³/day UF Plant
The model below assumes a 1,000 m³/day (365,000 m³/yr) UF skid on a moderately clean industrial feed (treated effluent at 10–30 mg/L TSS, no free oil), 600 m² of PES hollow-fiber membrane at $120/m², and 2–5 bar feed pressure. Adjust the unit-cost columns for your site.
| Year | Maintenance OPEX ($/m³) | OPEX ($/yr) | Major event | Year-end notes |
|---|---|---|---|---|
| Year 1 | $0.05 | ~$18,000 | None — baseline | CIP every 3–4 weeks, clean-water permeability at 100% |
| Year 2 | $0.07 | ~$25,500 | None | CIP frequency ticks up to every 2 weeks, mild fouling layer |
| Year 3 | $0.08 + $72k event | ~$95,000–$110,000 | Full membrane replacement (~$72,000) | Triggered by >20% flux decline at constant TMP; integrity test borderline |
| Year 4 | $0.06 | ~$22,000 | None — post-replacement trough | CIP returns to every 3 weeks on fresh membranes |
| Year 5 | $0.08 | ~$29,000 | None | CIP drifts back to every 2 weeks; budget Year 6 for next replacement |
| 5-yr total | — | ~$189,500–$204,500 | — | Annualized: $0.10–$0.11/m³ |
Roll-up for the CFO: across the 5-year window, the annualized maintenance cost on a clean feed lands at $0.10–$0.11/m³. Push the feed into the oily/high-TSS band and the same model yields $0.18–$0.22/m³ annualized, because the replacement event lands in Year 2 instead of Year 3 and the CIP chemical bucket roughly doubles. The number to defend in front of finance is the range, not a point: $0.08–$0.14/m³ for clean-to-moderate feeds, $0.15–$0.25/m³ for oily/high-TSS industrial feeds. If your plant is already running outside that range, the model is wrong — either the feed is worse than you are documenting, or the membranes are overdue. This is also a useful sanity check against generic industry quotes: the AGS-UF study's €0.223/m³ total OPEX (~$0.24/m³ at 2026 FX) is fully consistent with the upper end of this model, and most of that OPEX is energy and capital recovery — not maintenance.
When to Keep UF, When to Switch to MBR
The decision threshold is a number, not a feeling. If your measured UF maintenance OPEX — routine upkeep plus the amortized replacement event — exceeds $0.15/m³ sustained over 12 months, the membrane is the wrong tool for the feed. Confirm with two diagnostic steps before pulling the trigger on a process change: (1) plot flux versus TMP over the previous 6 months; if the curve has shifted more than 20% to the right of the clean-water baseline and CIP cannot recover it, fouling is irreversible. (2) Run a clean-water permeability test on a representative module; if recovery is below 70% of the commissioning value, the fiber is at end-of-life regardless of what CIP shows.
The natural next step for high-COD industrial feeds is a submerged MBR system. MBR uses 0.1 µm PVDF flat-sheet or hollow-fiber modules with continuous aeration scouring, which roughly halves CIP frequency on tough feeds. The trade-off is real: MBR aeration consumes 0.3–0.6 kWh/m³, roughly double a pressure UF skid, but chemical OPEX drops 30–50% because biological activity does most of the foulant breakdown. The net effect on a food, textile, or metalworking feed is usually a 15–25% reduction in total OPEX versus forcing a pressure UF to do the same job. A four-question checklist to decide:
- Is feed TSS sustained above 50 mg/L?
- Is oil/grease above 15 mg/L without consistent DAF removal upstream?
- Is CIP frequency already at weekly or shorter intervals?
- Is the integrity test pass rate below 95% over the last 6 months?
Three or more "yes" answers means the plant has outgrown pressure UF for this duty cycle. Two or fewer means the existing skid is still the right answer — budget for a planned replacement and a DAF upgrade, not a process switch.
Frequently Asked Questions
How long do industrial UF membranes actually last? 4–5 years on pre-treated surface water or clarified effluent, 3–4 years on treated secondary effluent, and 1.5–3 years on oily or high-TSS industrial feeds. End-of-life is defined by either >20% flux decline at constant TMP that CIP cannot reverse, or an integrity test failure — not by a calendar date (HydropureWater field data, 2026).
How often should I run CIP? On a clean surface-water feed, every 2–4 weeks. On treated secondary effluent, every 1–2 weeks. On oily industrial wastewater, every 2–5 days. Trigger CIP by a 15–20% rise in TMP at constant flux, not by the calendar — time-based CIP wastes chemicals and shortens membrane life.
How frequently do I need to integrity-test? Weekly pressure-decay or bubble-point testing on potable and water-reuse service is the industry baseline (per EPA 2017 membrane filtration guidance and most state primacy agency rules). Daily diffusive flow monitoring is standard on large municipal reuse plants. Non-potable industrial service can drop to monthly if no downstream barrier exists.
How does UF maintenance cost compare to RO? UF runs at 2–5 bar versus 10–30 bar for RO, so energy OPEX is 3–6× lower. Membrane replacement is also cheaper per m². But RO delivers higher rejection; per Morui, NF/RO systems cost 20–35% more to install than UF, and their operating cost premium is similar. For plants that need permeate-grade water, the realistic comparison is UF pretreatment → RO polishing, not UF alone versus RO alone.