Why Circuit Board Wastewater Breaks Conventional Precipitation
A typical PCB fab discharges a far more aggressive envelope than municipal or generic metal-finishing guides assume: Cu²⁺ at 50–500 mg/L from electroless and electroplating rinses, Ni²⁺ at 5–50 mg/L from ENIG and plating baths, total Pb at 0.5–10 mg/L from HASL and solder plating, COD at 200–2,000 mg/L from desmear, developer, and photoresist strip streams, and a working pH swinging from 1 (etchant rinse) to 13 (alkaline developer overflow). Fluoride rides along at 20–200 mg/L from solder dross dissolution; free and complexed cyanide (CN⁻, Cu(CN)₄²⁻) appear sporadically in plating rinses; NH₃-N can exceed 100 mg/L in electroless copper baths. That is the real influent matrix, and it is exactly where hydroxide chemistry falls apart.
NaOH and Na₂S precipitation work on free metal ions, but the desmear and electroless copper streams carry 200–2,000 mg/L EDTA, gluconate, and ammonium-based complexants that hold Cu²⁺ in solution above pH 9. Pushing the dose to break those complexes requires 3–5× stoichiometric excess, drives pH above 10, and produces 8–15 kg of metal-laden hazardous sludge per cubic meter treated. The sludge fails TCLP for Cu and Pb at typical generator thresholds (40 CFR 261.24), so it ships out as a Class I waste at $200–$600/ton. Compliance targets do not get easier: China GB 21900-2008 sets total Cu at 0.5 mg/L and total Ni at 0.5 mg/L for electroplating discharges, and the Taiwan EPA effluent limits are Cu ≤ 1.0 mg/L, Ni ≤ 0.5 mg/L, total-Pb ≤ 0.5 mg/L. To meet those numbers on chelated copper, hydroxide alone is not a defensible basis. Independent lab data puts 80% COD removal on a domestic surrogate at just 5 A and 10 min in a bench EC cell (YASA ET, 2024), which is the floor an EC system must beat on a real PCB stream — and it does, because the cell generates its own coagulant in situ and pulls metals out of the chelated complex rather than fighting it with bulk alkali.
How an Electrocoagulation Cell Actually Treats PCB Water
Three reactions run simultaneously inside an electrocoagulation cell, and the engineer who understands them stops treating EC as a black box. At the anode, the sacrificial plate oxidizes and dissolves: Al → Al³⁺ + 3e⁻ (or Fe → Fe²⁺ + 2e⁻ on iron anodes). At the cathode, water reduces to hydrogen gas and hydroxide: 2H₂O + 2e⁻ → H₂ + 2OH⁻. The fine H₂ bubble stream lifts suspended solids and floated floc to the surface, while the charge on the dissolved Al³⁺ drives electrophoretic migration of negatively charged colloids — photoresist particles, oil droplets, and broken emulsion droplets — toward the anode, where they coagulate.
The in-situ coagulant pathway is what does the real work on PCB streams. Al³⁺ released at the anode hydrolyzes through Al(H₂O)₆³⁺ → Al(OH)²⁺ → Al(OH)₃(s) → Al(OH)₄⁻ as pH climbs from the anode surface outward. The amorphous Al(OH)₃ floc has a surface area of 200–400 m²/g and a point of zero charge near pH 7.5, so it adsorbs Cu²⁺, Ni²⁺, Pb²⁺, F⁻, and emulsified organics with high affinity. For chelated copper, the local pH spike at the anode surface destabilizes the Cu-EDTA complex; once the EDTA shell breaks, the freed Cu²⁺ reports to the floc.
Four knobs govern the cell, and the YASA ET data identifies them clearly: electrode configuration (mono-polar in parallel, mono-polar in series, or bi-polar), current intensity (A), treatment time (min), and influent pH. On PCB strength streams, the operating envelope is pH 6–9, inter-electrode gap 5–20 mm, hydraulic retention 10–60 min, and specific energy 0.5–3.0 kWh/m³. Below pH 6, Al(OH)₃ solubility climbs and removal efficiency drops 10–20 percentage points; above pH 9, Al passivates and Fe(OH)₃ starts to redissolve. The gap matters because every millimeter of extra spacing costs voltage — a 20 mm gap at 150 A/m² draws roughly 8–12 V across the cell, while a 5 mm gap draws 3–5 V at the same current density. On a 50 m³/h train, that gap decision is the difference between 12 kW and 35 kW of rectifier capacity.
Electrode Metallurgy: Aluminum, Iron, and DSA/MMO for PCB Chemistry
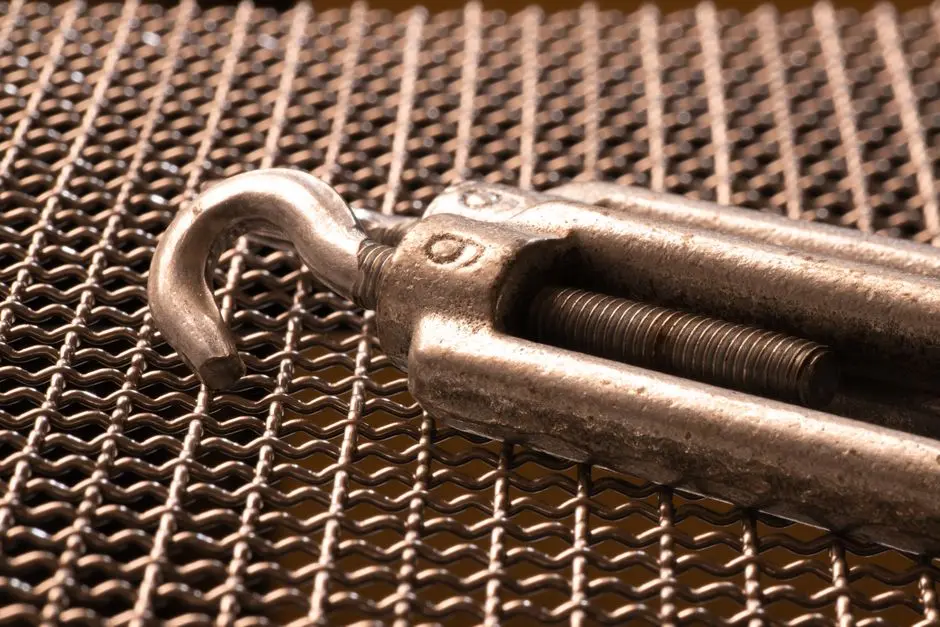
Electrode metallurgy is the single most expensive design decision in an EC skid, and it is the one that generic EC articles get wrong for PCB service. The trade-off is not "Al versus Fe" — it is Al versus Fe versus DSA/MMO cathodes paired with sacrificial anodes, sized to the contaminant mix.
| Anode material | Best-fit PCB stream | Cu²⁺ removal | Sacrificial rate | Sludge character | Relative electrode cost |
|---|---|---|---|---|---|
| Aluminum (Al 1050/1060) | Acidic electroless Cu, desmear, etchant rinse; chelated Cu | 95–99% | 0.1–0.3 kg-Al per kg-Cu removed | White, low-density Al(OH)₃ + Cu(OH)₂; TCLP-passable at high Cu loadings only with stabilization | Low (baseline) |
| Iron (Fe mild steel) | High-COD rinses, chromate co-present, arsenic, sulfide-bearing streams | 80–95% | 0.2–0.5 kg-Fe per kg-Cu removed | Dense, dark Fe(OH)₃ magnetic floc; faster settling, easier dewatering | Low |
| DSA / MMO-coated Ti (cathode) | Paired with Al or Fe anode in large flows | n/a (cathode) | Zero — non-sacrificial | No contribution | High (3–6× Al plate), but cuts 10-year electrode OPEX 40–60% |
Aluminum anodes hit 95–99% Cu²⁺ removal on acidic etchant rinse and are the default for chelated Cu streams, but passivate above pH 9 and tolerate chloride poorly above 5,000 mg/L. Iron anodes are preferred where chromate, arsenic, or high COD co-exist; the Fe²⁺ → Fe³⁺ oxidation at the anode surface generates a magnetic Fe₃O₄ floc with a settling rate of 8–15 m/h, roughly 3× faster than Al(OH)₃. For larger PCB fabs (above ~20 m³/h), the practical specification is an Al anode plate with a DSA/MMO cathode, a 6–10 mm inter-electrode gap, and plate area sized to deliver 50–150 A/m² at the design flow. The pH-adjust dosing skid upstream of the EC cell should hold influent at pH 7 ± 0.5 to keep both metals in their optimal coagulation window and prevent Al passivation.
Removal Performance by Contaminant: Cu, Ni, Pb, COD, F⁻, CN⁻
This is the table an engineer pastes into a process design basis. Numbers below are drawn from peer-reviewed PCB EC studies and vendor field data; they are performance ranges, not guarantees, and they assume proper jar-test confirmation on the actual site stream before CAPEX commitment.
| Contaminant | Typical PCB influent (mg/L) | Operating window | EC removal (%) | Notes |
|---|---|---|---|---|
| Cu²⁺ (free) | 50–500 | pH 7–8, 50–150 A/m², 30 min | 95–99 | Best-case target; Al anode preferred |
| Cu²⁺ (EDTA-chelated) | 20–200 | pH 7–8, 80–200 A/m², 30–45 min | 85–95 | Local pH spike at anode breaks complex; longer retention |
| Ni²⁺ | 5–50 | pH 7–9, 80–150 A/m², 30–45 min | 85–95 | Slower hydrolysis than Cu; raise CD or retention |
| Total Pb | 0.5–10 | pH 7–10, 50–150 A/m², 30 min | 90–98 | Pb(OH)₂ low solubility across neutral band |
| COD (chelated rinse) | 200–2,000 | pH 7–8, 50–150 A/m², 30 min | 70–90 | Drops to 50–70% when EDTA > 500 mg/L — flag as EC ceiling |
| Fluoride (F⁻) | 20–200 | pH 6–8, 50–100 A/m², 30 min | 60–85 | Co-precipitation with Al(OH)₃ floc |
| Free CN⁻ | 1–20 | pH > 9, 100–200 A/m² | 30–60 | Partial anodic oxidation; full destruction needs alkaline chlorination downstream |
| Tin (Sn) | 5–30 | pH 7–8, 50–150 A/m², 30 min | 80–95 | Co-removes with Cu floc |
The practical ceiling on standalone EC is EDTA above ~500 mg/L — at that loading, COD removal falls under 70% and the Cu-EDTA complex begins to pass through the floc. The engineering response is either a peroxide-assisted EC stage (Fe²⁺ + H₂O₂ Fenton-like at the anode) to break the chelator first, or positioning EC as the bulk-removal step with MBR polishing downstream. Jar testing on a 1-L sample at 50–150 A/m², 30 min, and pH 6.5/7.5/8.5 is non-negotiable before any equipment order.
EC vs DAF vs Chemical Precipitation vs Ion Exchange: A 2026 Comparison
Procurement will already be evaluating three competing technologies. Here is how they line up against EC on the metrics that matter for a CAPEX line item.
| Criterion | EC | DAF | Hydroxide precipitation | Ion exchange (chelating resin) |
|---|---|---|---|---|
| CAPEX (USD per m³/d) | $1,500–$4,000 | $800–$2,000 | $300–$900 | $2,500–$6,000 |
| OPEX (USD per m³) | $0.40–$1.20 | $0.15–$0.40 | $0.60–$1.80 (chemicals + sludge disposal) | $0.80–$2.00 (resin + regenerant) |
| Sludge volume (kg/m³ treated) | 0.2–0.6 | 0.1–0.3 (with coagulant) | 2.0–8.0 (hydroxide + sulfide) | 0.05–0.15 (resin-bound) |
| Sludge TCLP status | Often passes with Fe anode; borderline with Al at high Cu | Passes with proper coagulant choice | Fails TCLP routinely for Cu/Pb | Resin classified as hazardous when loaded |
| Chelated-metal tolerance | High (destabilizes complex at anode) | Low without upstream oxidation | Very low (needs 3–5× stoichiometry) | Low to moderate (EDTA fouls resin) |
| Effluent Cu achievable | 0.5–5 mg/L (single stage) | 1–10 mg/L | 0.5–2 mg/L (free metal only) | < 0.1 mg/L (polishing grade) |
EC wins on chelated streams and on sludge toxicity — the two failure modes that drive PCB fabs off hydroxide chemistry. DAF still polishes the floated EC floc and removes emulsified oils that the EC cell lifts but does not fully separate, which is why a DAF polishing unit for floated EC floc sits immediately downstream in nearly every working train. Ion exchange is a polisher to < 0.1 mg/L, not a bulk-removal workhorse, and its regeneration brine is itself a wastewater problem. EC is the pre-treatment or equalization step; it is not a standalone polish for a 0.5 mg/L Cu discharge limit.
Where EC Sits in a 2026 Zero-Liquid-Discharge Train
The recommended 2026 ZLD train for a PCB fab runs in this order: equalization + pH adjust → EC cell → DAF (skim floated floc) → MBR (polish residual COD and TSS) → two-pass RO (concentrate) → brine evaporator or crystallizer. EC goes first, deliberately, because it removes 95–99% of Cu and 70–90% of COD before the water ever touches a membrane. Independent operating data on hybrid trains shows this positioning extends MBR/RO membrane life by 2–3× and reduces RO cleaning frequency from weekly to monthly, which on a 50 m³/h line is the difference between 8–12 membrane replacements per year and 3–4.
The 99.9% Cu recovery number that gets a CAPEX line approved comes from this configuration, not from EC alone — EC concentrates the metal into a small-volume floc that the DAF skims, the MBR captures the residual solids, and the RO retentate recycles back to the EC cell as a closing loop. The 2026 ZLD blueprint for PCB fabs walks the mass balance end-to-end with evaporator heat-duty numbers; the hybrid DAF-RO-MBR spec guide at PCB wastewater plant 2026 hybrid DAF-RO-MBR spec guide carries the equipment-level CAPEX breakdown that procurement will ask for next. The MBR polisher downstream of the EC + DAF train is the unit that lets the RO hit its design flux.
Sizing Example and CAPEX/OPEX Benchmarks for 2026
Worked example for a 50 m³/h PCB fab wastewater stream with Cu at 200 mg/L, Ni at 20 mg/L, COD at 800 mg/L, pH 3 (etchant + desmear blend after equalization to pH 7): design current density 100 A/m², target Cu removal 95%, retention 30 min. Required cell volume is 25 m³, split into 4 cells of 6.25 m³ in series to keep the rectifier under 600 V. Anode area at 100 A/m² and the chosen plate geometry (1.0 m × 0.5 m, both faces active) is 600 m² total, requiring roughly 1,200 plates. Specific energy at 100 A/m² and a 8 mm gap runs 1.5–2.0 kWh/m³, so the rectifier draws 75–100 kW. Aluminum consumption at 0.2 kg-Al per kg-Cu removed and 9.5 kg-Cu removed per hour is 1.9 kg/h, or 0.038 kg-Al per m³ treated.
Order-of-magnitude 2026 pricing for a 10–50 m³/h EC skid with rectifier, PLC, and skimmer runs USD 80,000–350,000 depending on plate material and DSA cathode content. OPEX is dominated by electrode wear and power: USD 0.40–1.20 per m³ treated at 2026 electricity and aluminum prices, with chemical cost near zero (the cell generates its own coagulant). Payback against a hydroxide precipitation baseline of USD 0.60–1.80 per m³ in chemicals plus $200–$600 per ton of hazardous sludge disposal falls in the 14–28 month range, before any credit for recovered copper metal from the EC floc through an off-taker. A first-pass CAPEX memo to procurement can carry these numbers as the design basis, with the jar-test result as the gating milestone before PO release.
Frequently Asked Questions
What current density should I specify for copper removal on a PCB rinse stream? 50–150 A/m² is the working window for free Cu²⁺ at 50–500 mg/L; push to 80–200 A/m² when the stream is EDTA-chelated, because the local pH spike at the anode needs more Al³⁺ flux to break the complex within a 30–45 min retention (HydropureWater field data, 2026).
Can EC alone meet the China GB 21900-2008 Cu limit of 0.5 mg/L on chelated streams? Single-stage EC typically reaches 0.5–5 mg/L Cu; on chelated influent, count on a two-stage EC + MBR polish, or EC + ion-exchange polish, to land at 0.5 mg/L or below (per GB 21900-2008 electroplating effluent limits).
How does EC sludge compare with hydroxide precipitation sludge on disposal cost? EC generates 0.2–0.6 kg/m³ of floc versus 2–8 kg/m³ for hydroxide, and the Fe-anode floc frequently passes TCLP for Cu and Pb at typical generator thresholds, avoiding Class I hazardous-waste disposal fees of $200–$600/ton.
What is the right place for EC in a 2026 ZLD train? First, after equalization and pH adjust, before DAF and the MBR polisher downstream of the EC + DAF train; this positioning extends RO membrane life 2–3× and is detailed in the 2026 ZLD blueprint for PCB fabs.
Aluminum or iron anodes for a mixed PCB stream with chromate and high COD? Iron anodes are the better fit when chromate, arsenic, or COD above 1,500 mg/L co-exist, because the Fe²⁺ → Fe³⁺ pathway generates a denser magnetic floc with a settling rate 3× that of Al(OH)₃; use Al anodes when the priority is maximum Cu²⁺ removal on chelated streams (HydropureWater field data, 2026).