Where the Desalination Market Stands in 2026
Three independent 2026 baselines now triangulate the desalination market, and the numbers tell a consistent story of double-digit equipment growth driven by industrial demand. The broadest figure — total global market value — sits at $20.76B in 2026, projected to reach $38.20B by 2033 at a 9.1% CAGR (per the 2026-2033 YoY forecast). The equipment-only segment, which is the line item an industrial buyer actually spends against, is growing even faster: $19.23B in 2025 → $21.45B in 2026 at 11.5% CAGR (TBRC 2026 report). A third long-range outlook puts the total market at $17.76B in 2025 expanding to $38.80B by 2034 at 9.07% CAGR (Renub Research, 2026-2034).
These three numbers are not redundant — they describe three different sub-markets a buyer must keep straight. The $20.76B figure covers the full services + equipment + consumables value chain. The $21.45B figure isolates capital equipment (membrane skids, high-pressure pumps, energy-recovery turbines, pre-treatment trains). The Renub figure is a longer horizon that folds in membrane replacement consumables, EPC services, and 10-year O&M. Because equipment is compounding at 11.5% versus services at roughly 9%, the 2026 signal is unambiguous: capex on hardware is outpacing long-term O&M contract growth, and the marginal dollar in this market is going into pumps, membranes, and skids — not into operating existing plants.
For an industrial engineer evaluating a 2026 procurement decision, the practical takeaway is that vendor lead times on RO skids and energy-recovery devices are tightening, and the equipment supply chain itself is the bottleneck, not the demand side.
| Forecast Source | Scope | 2025 Baseline | 2026 Value | Endpoint | CAGR |
|---|---|---|---|---|---|
| 2026-2033 YoY Forecast | Total market (services + equipment + consumables) | — | $20.76B | $38.20B (2033) | 9.1% |
| TBRC 2026 Report | Equipment only | $19.23B | $21.45B | — | 11.5% |
| Renub Research 2026-2034 | Total market, long-range | $17.76B | — | $38.80B (2034) | 9.07% |
Why Industrial Buyers — Not Municipal Utilities — Are Driving 2026 Demand
Most of the top-ranking desalination coverage treats the market as a municipal water-security story. That framing is wrong for 2026 industrial procurement. The five sectors actually writing purchase orders in 2026 are power generation, oil & gas (upstream injection water and refinery boiler feed), semiconductor fabrication, pharmaceuticals, and food & beverage. The reason is straightforward economics: once an industrial plant crosses roughly 5,000 m³/day of process water demand, the unit cost of on-site desalination plus reuse falls below municipal freshwater tariffs, and the capex payback drops to 3–5 years without subsidies.
Feedwater quality separates these industrial buyers from municipal projects. Middle East municipal tenders still anchor on seawater (TDS 35,000–45,000 mg/L), but inland industrial sites — Texas, inland China, the Indian subcontinent, the US Southwest — are the fastest-growing source category in 2026, working with brackish water at TDS 1,000–10,000 mg/L. Brackish water RO runs at lower pressure (10–15 bar versus 55–80 bar for seawater), achieves 75–90% recovery versus 35–50% for seawater, and cuts OPEX by roughly half. For a procurement lead evaluating a 2026 bid, the source-water TDS is the single most important number on the data sheet — it determines whether thermal desalination is even worth evaluating.
Power plants targeting zero-liquid-discharge (ZLD) now layer RO with thermal evaporation or crystallization to hit >95% water recovery, which doubles per-site desalination equipment spend versus a discharge-permitted site. Semiconductor fabs are the highest-margin 2026 sub-segment: ultra-pure water (UPW) trains pull RO + electrodeionization (EDI) + mixed-bed polishing to hit resistivity of 18.2 MΩ·cm, and the consumables cycle on those mixed-bed resins is what drives multi-year service revenue. A deeper water reuse regional analysis for 2026 industrial markets shows the same segmentation pattern across MENA, North America, and East Asia.
| Industrial Sector | Typical Feedwater (TDS) | Dominant Tech | Typical Recovery Target | 2026 CAPEX Band (per m³/day) |
|---|---|---|---|---|
| Power generation (boiler feed) | 500–3,500 mg/L (brackish) | Brackish RO + polishing | 80–90% | $900–$1,400 |
| Oil & gas (upstream injection) | 3,000–15,000 mg/L (produced water blend) | RO + softening | 70–85% | $1,100–$1,800 |
| Semiconductor (UPW) | <500 mg/L (pre-treated city water) | RO + EDI + mixed-bed | 85–95% | $1,500–$2,500+ |
| Pharmaceuticals (WFI feed) | 1,000–5,000 mg/L | RO + EDI + distillation | 80–90% | $1,300–$2,000 |
| Food & beverage (process water) | 500–2,000 mg/L | Brackish RO | 75–85% | $800–$1,300 |
Technology Mix in 2026: RO, Thermal, and What's Actually Winning
Reverse osmosis holds the dominant 2026 market share because specific energy consumption has dropped to 2.5–3.5 kWh/m³ for seawater and 0.5–1.5 kWh/m³ for brackish water with modern energy-recovery devices — versus 6–8 kWh/m³ for pre-2010 RO plants without ERDs (per industry-standard engineering references). That single number explains why thermal desalination is no longer the default for new builds: at fuel-oil prices of $80/barrel, MSF and MED thermal plants run at 10–15 kWh/m³ thermal equivalent, which is only competitive when waste heat is genuinely free.
Multi-Stage Flash (MSF) and Multi-Effect Distillation (MED) therefore remain relevant only in a narrow 2026 window: co-located with combined-cycle power plants exporting low-grade waste heat, or where feedwater TDS exceeds 40,000 mg/L and membrane scaling becomes uneconomical. Thermal recovery rates sit at 35–45% maximum — well below RO. Forward osmosis (FO) and electrodialysis (ED) are 2026 niche technologies for high-recovery brine concentration upstream of crystallizers in a ZLD train, but they lack the commercial-scale reference plants a risk-averse EPC buyer wants to see on a P&ID.
Pre-treatment is the deciding factor most procurement documents underweight. Without a multi-media pre-treatment filter for SDI reduction knocking the Silt Density Index below 5, no RO membrane will survive its rated 3–5 year cycle. The industrial RO system with up to 95% recovery specifications in the HydropureWater catalog assume incoming SDI <3, which means a properly sized multimedia filter upstream. Engineers who skip this and feed raw well water into RO skids typically see membrane replacement cycles collapse from 5 years to 18–24 months.
| Technology | Specific Energy (kWh/m³) | Recovery Rate | Best-Fit Feedwater TDS | 2026 Application Fit |
|---|---|---|---|---|
| Reverse Osmosis (RO) — seawater, with ERD | 2.5–3.5 | 35–50% | 35,000–45,000 mg/L | Coastal municipal, industrial power, O&G |
| Reverse Osmosis (RO) — brackish | 0.5–1.5 | 75–90% | 1,000–10,000 mg/L | Inland industrial, food & beverage, pharma |
| Multi-Stage Flash (MSF) | 10–15 thermal | 35–45% | >40,000 mg/L | Power co-gen, legacy Middle East plants |
| Multi-Effect Distillation (MED) | 6–10 thermal | 35–45% | >40,000 mg/L | Power co-gen, hybrid RO+MED |
| Forward Osmosis (FO) | 0.2–0.5 (draw solute recovery separate) | 85–95% | Any (brine concentration stage) | ZLD pre-crystallizer, 2026 emerging |
| Electrodialysis (ED/EDR) | 1.0–2.5 | 80–90% | 1,000–5,000 mg/L | Brackish niche, selective ion removal |
Industrial Cost Benchmarks for 2026 CAPEX and OPEX
Translating the trend into budget-defensible numbers: industrial RO plant CAPEX in 2026 sits at $800–$1,800 per m³/day of installed capacity, with the wide range driven by feedwater TDS, target recovery, and pre-treatment complexity (per HydropureWater field data, 2026). A brackish RO plant at 5,000 m³/day with standard multimedia pre-treatment and chemical dosing will land near the bottom of that band; a seawater RO at the same throughput with two-pass configuration and ERD sits at the top.
OPEX for industrial seawater RO in 2026 runs $0.30–$0.70 per m³ treated, with energy at 40–55% of that number and membrane replacement at 15–20%. Brackish water RO OPEX is materially cheaper — $0.10–$0.30 per m³ — because the lower feed pressure (10–15 bar versus 55–80 bar) cuts pump energy roughly 5× and higher recovery (75–90% versus 35–50%) reduces feedwater volume per m³ of permeate. RO membrane replacement cycle on a properly pre-treated industrial plant runs 3–5 years, with a replacement cost of $30–$60 per m³/day of installed capacity per event. An energy-recovery device on a seawater RO at industrial electricity tariffs above $0.08/kWh pays back in 2–4 years through reduced pumping energy alone.
| Cost Component | Seawater RO | Brackish RO | Notes (2026) |
|---|---|---|---|
| CAPEX (installed, per m³/day) | $1,200–$1,800 | $800–$1,300 | Includes pre-treatment, ERD, dosing |
| OPEX (per m³ permeate) | $0.30–$0.70 | $0.10–$0.30 | Energy + membranes + chemicals + labor |
| Energy share of OPEX | 40–55% | 30–40% | Seawater is high-pressure pumping |
| Membrane replacement cycle | 3–5 years | 3–5 years | SDI <3 extends life |
| Membrane replacement cost | $40–$60 / m³/day | $30–$50 / m³/day | Per replacement event |
| ERD payback (seawater only) | 2–4 years | N/A (not needed) | At electricity >$0.08/kWh |
2026 Decision Framework: How to Select Desalination Equipment for an Industrial Site
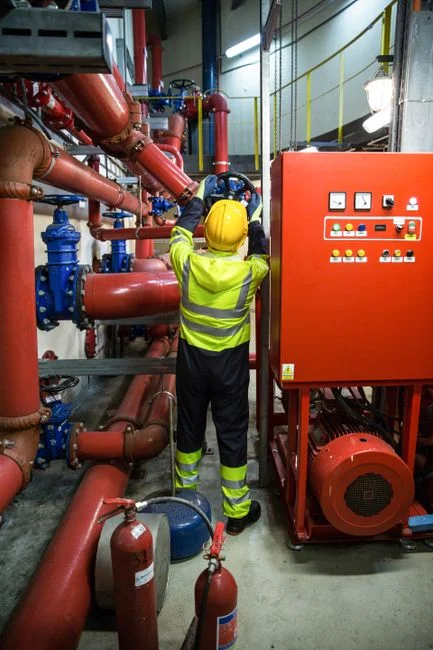
The market and technology data above only matter if a buyer can convert them into a selection decision. A defensible 2026 procurement sequence has five steps.
- Characterize the feedwater. Pull a full water analysis — TDS, SDI, temperature, organics, free chlorine, silica, barium, strontium. The TDS number alone routes the decision: brackish (1,000–10,000 mg/L) points to RO; seawater (35,000–45,000 mg/L) points to RO with ERD; hypersaline (>45,000 mg/L) starts to invite thermal or hybrid trains.
- Define the product water spec. Potable (TDS <500 mg/L), process water (TDS <200 mg/L), boiler feed (TDS <10 mg/L with silica limits), or UPW (18.2 MΩ·cm resistivity). Each spec changes the downstream polishing train and the consumables budget.
- Match technology to the energy profile. If the site has free waste heat from a gas turbine or process flare, MED/MSF remains in the conversation. If grid power is the primary driver, RO with ERD wins on both capex and opex. For sites with variable load (mining camps, seasonal food processing), modular RO skids are the right answer because they scale in 500–1,000 m³/day increments.
- Plan concentrate management before signing the RO PO. Coastal sites can use marine outfalls but face tightening 2026 brine discharge regulations; inland sites need evaporation ponds, ZLD crystallization, or deep-well injection — each with its own capex line. Concentrate management is a separate budget from the RO skid itself, and engineers who treat it as a footnote end up with stranded assets.
- Verify supplier scope. An integrated water purification skid for industrial feedwater with pre-treatment, RO, post-treatment, and automation in one package beats a bare RO vessel quote once commissioning and after-sales membrane logistics are priced in. Confirm the supplier stocks replacement membranes regionally and supports the automatic chemical dosing system for RO antiscalant and CIP chemistry, not just the pressure vessels.
What Changes Between 2026 and 2028: Forward Signals Buyers Should Track
Three signals will reshape the 2026 baseline by 2028, and each one changes what a capex planner should be specifying today.
Brine regulations are tightening, not loosening. The EU's revised Urban Wastewater Treatment Directive, Saudi Arabia's updated brine discharge rules, and California's evolving Ocean Plan are all moving concentrate limits downward in 2026. The implication: brine management cost shifts from a footnote to a line item, and inland sites that haven't planned for ZLD or deep-well injection will face retrofit costs within 36 months. Procurement specs written in 2026 should already assume >80% recovery as the default, not as an upgrade option.
Modular containerized RO skids are shortening project timelines. Factory-built, containerized RO units cut site installation from 12–18 months to 4–6 months because the high-pressure piping, ERD, and controls are pre-commissioned before shipment. Demand for this format is up sharply in 2026 from mining, food & beverage, and remote O&G operators. A spec written for stick-built should be revisited if the project timeline is under 9 months.
Energy-recovery turbines are crossing 95% isentropic efficiency. That pushes seawater RO specific energy below 2.5 kWh/m³ for the first time, which expands the economic feasibility of seawater RO to smaller plants (under 1,000 m³/day) that previously could not justify the capex. Anyone evaluating a 2026 build at 500–2,000 m³/day should re-run the economics with a 2.2–2.4 kWh/m³ assumption rather than the older 3.0–3.5 kWh/m³ default. The wider membrane technology market drivers in 2026 are pulling in the same direction — lower energy, higher recovery, modular delivery.
Frequently Asked Questions
How big is the desalination market in 2026? The total global desalination market is valued at $20.76B in 2026 and is projected to reach $38.20B by 2033 at a 9.1% CAGR (per the 2026-2033 YoY forecast). The equipment-only segment is valued at $21.45B in 2026, growing at 11.5% CAGR (TBRC 2026).
Which desalination technology has the largest 2026 market share? Reverse osmosis holds the dominant share because specific energy consumption has dropped to 2.5–3.5 kWh/m³ for seawater and 0.5–1.5 kWh/m³ for brackish feedwater with modern energy-recovery devices. MSF and MED remain in use only where waste heat is free; FO and ED are 2026 emerging niches.
What does an industrial RO plant cost in 2026? Industrial RO plant CAPEX in 2026 ranges from $800–$1,800 per m³/day of installed capacity depending on feedwater TDS and pre-treatment complexity. OPEX runs $0.10–$0.30 per m³ for brackish water and $0.30–$0.70 per m³ for seawater.
Which industries are driving 2026 desalination equipment demand? Power generation, oil & gas (upstream injection and refining), semiconductor fabrication, pharmaceuticals, and food & beverage are the top 2026 industrial buyers, with semiconductor UPW the highest-margin sub-segment.
Is equipment or services growing faster in the desalination market? Equipment is growing faster, at 11.5% CAGR versus approximately 9% for services. The 2026 signal is that capex on hardware — pumps, membranes, ERDs, skids — is outpacing the growth of long-term O&M contracts.