Why 2026 Is an Inflection Year for Membrane Technology
The membrane separation market in 2026 sits at an addressable value of roughly $35–40 billion globally when you aggregate MBR, RO/NF, UF/MF, ceramic, and emerging thin-film composite platforms (Grand View Research 2022 base extrapolated at ~8% CAGR). The membrane bioreactor (MBR) sub-segment alone is on a documented trajectory from $3.8 billion in 2024 to $5.8 billion by 2030, a 7.7% CAGR that is heavily weighted toward industrial and water-reuse duty rather than municipal. The commercial research market has noticed: CMR 23316, the most-c付费 2025 membrane separation forecast, sells for $4,250 per copy, which is itself a signal of how much a 2026 driver analysis is worth to procurement teams right now.
Seven converging forces are driving the membrane technology market in 2026: tightening PFAS and micropollutant regulations, industrial water reuse mandates, zero-liquid-discharge (ZLD) adoption in semiconductors and pharmaceuticals, falling ceramic-membrane cost curves, energy-efficient MBR designs replacing CAS, Asia-Pacific capacity buildouts, and AI-driven fouling control. Each of the next seven sections pairs one driver with one equipment-selection implication, so that by the end of the article you have a defensible decision framework for your 2026 CAPEX conversation, not a generic market overview. Five of the seven drivers sit in a 0–2 year action window, which is why 2026 is the procurement year, not 2028.
Driver 1: PFAS and Micropollutant Regulations Reach Enforcement
The U.S. EPA's 2024 PFAS National Primary Drinking Water Regulation set MCLs at 4 ng/L for PFOA and PFOS, with compliance deadlines phasing through 2027–2029 (EPA 40 CFR 141.900). That timeline makes 2026 the design-and-procurement year for any industrial WWTF discharging to a POTY or producing reuse water. Granular activated carbon (GAC) and ion exchange resins can polish the low-PPB residuals, but they cannot do the primary rejection work at the flow rates industrial plants generate; high-pressure RO and tight NF are required as the primary rejection stage, almost always paired with GAC polishing upstream or downstream.
On the European side, the 2024 recast of the Urban Wastewater Treatment Directive (Directive 2024/3019) expanded the Watch List to include pharmaceutical residues and other micropollutants, pushing tertiary membrane steps into plants that previously discharged to a biological-only train. The design impact is quantifiable: a typical 5 MGD industrial WWTF retrofitting for PFAS removal adds 15–25% CAPEX, with the membrane stage alone representing 50–60% of that increment (HydropureWater field data, 2026). For readers scoping a 2026 PFAS retrofit, the process architecture is detailed in the biopharmaceutical effluent plant design guide for 2026.
Driver 2: Industrial Water Reuse and Circular-Water Mandates
The demand-side pull is now as important as the regulatory push. China's 2022–2025 Water-Saving Industrial Policy set binding reuse rates for high-water-intensity sectors, and India's 2025 Extended Producer Responsibility framework extends that logic to specific industrial discharge streams. In water-stressed regions the 2026 reuse-revenue benchmark is unambiguous: industrial reuse water is valued at $1.50–4.00 per m³ versus freshwater intake at $0.30–0.80 per m³, which drops RO/UF payback periods to 2–4 years once concentrate disposal cost is netted out (per regional water tariff surveys, 2025).
Semiconductor fabs under construction in Taiwan, Arizona, and Germany are specifying >85% water reuse rates for 2026 builds, which is mechanically an RO plus EDI train fed by a high-quality MBR or UF pre-treatment. Submerged MBR effluent — typically <1 µm turbidity, COD <30 mg/L — is now the de facto feed-quality standard for downstream RO in industrial reuse trains, and the MBR vs MBBR engineering comparison for 2026 breaks down the operating envelope where each pre-treatment technology wins. Submerged MBR systems for industrial reuse trains in this duty class typically run at 15–25 LMH with intermittent relaxation cycles, which is the operating point that minimizes chemical cleaning frequency over a 5-year membrane life.
Driver 3: Zero-Liquid-Discharge Becomes the Default for New Industrial Plants
Zero-liquid-discharge has shifted from a niche compliance option to the 2026 default design baseline for new plants in textiles, dyes, pharmaceuticals, and power-plant FGD blowdown in China and India, with active enforcement from 2024 onward. The 2026 ZLD stack has stabilized: UF pre-treatment, followed by brackish RO, followed by high-pressure RO or DTRO, followed by a crystallizer for the final solids. That sequence has displaced the older evaporator-first designs because it cuts thermal energy demand by 60–70% (HydropureWater field data, 2026).
DTRO (disc-tube RO) is the sub-segment gaining share fastest, because it handles 70,000+ mg/L TDS feed, the operating envelope where conventional spiral-wound RO elements fail mechanically. The global high-pressure RO membrane segment is forecast to grow at roughly 10–12% CAGR through 2030, making it the fastest-growing sub-segment of the entire membrane market. Display-panel fluoride wastewater treatment systems for ZLD duty are a representative case: fluoride-bearing spent etch streams at 8,000–15,000 mg/L F⁻ require a high-pH DTRO pass before the crystallizer to avoid scaling the evaporator tubes. The design lesson is that ZLD is no longer a process question of "if" but a procurement question of "which membrane stage first."
Driver 4: Ceramic Membranes Cross the Cost-Viability Threshold
Ceramic UF and MF element prices have fallen roughly 30–40% since 2021 as Chinese and Japanese manufacturers scaled production capacity and standardized geometries around 19-channel and 37-channel monolithic elements. In 2026, ceramic membranes are a procurement option, not a research curiosity, for specific harsh streams: high-temperature service above 50 °C, oil-and-grease emulsions above 500 mg/L, abrasive mining tailings, and aggressive chemical cleaning cycles across the full pH 0–14 range.
The durability case is the one that flips the TCO calculation: ceramic elements deliver 10–15 year service life versus 5–8 years for polymeric equivalents, which offsets a 2–3× higher unit capex on a 10-year net present value basis for any plant running 24/7 with limited maintenance windows. The 2026 commercial reality is that at least four major ceramic suppliers — Jiuwu, Meidensha, Novasep, and Liqtech — are quoting 2026 delivery for industrial-scale ceramic trains above 50 m³/h (HydropureWater supplier qualification records, 2026). Industrial RO systems for PFAS and high-rejection duty that follow a ceramic UF pre-filter can run at sustained flux 25–30% higher than the same train with a polymeric UF, because the ceramic pre-filter delivers a tighter and more stable SDI to the RO elements. Silicon-carbide ceramic membrane selection for zero-fouling duty covers the engineering specification logic in detail for harsh-stream applications.
Driver 5: Energy-Efficient MBR Designs Replace Conventional Activated Sludge
The MBR sub-segment is on the documented $3.8 billion (2024) to $5.8 billion (2030) trajectory, a 7.7% CAGR, and that growth is concentrated in industrial and water-reuse applications rather than greenfield municipal plants. The reason is the energy curve: modern submerged PVDF MBRs operate at 0.3–0.5 kWh/m³ versus 0.8–1.2 kWh/m³ for the first-generation external cross-flow designs that dominated the early 2010s (HydropureWater operating-data review, 2024–2025). That puts MBR-specific energy within striking distance of a well-tuned CAS plant once you account for the footprint and clarification savings.
Footprint is the second decisive variable. A submerged MBR train occupies roughly 60% less land than a CAS train with a secondary clarifier, which is a non-negotiable advantage in brownfield retrofits where the existing tank farm cannot be expanded. The consequence is structural: MBR is no longer competing with CAS on operating cost, it is competing on footprint, effluent quality, and reuse readiness, and on those three axes the 2026 default is MBR for any plant in the 10–2,000 m³/day range producing reuse-grade effluent. PVDF flat-sheet membrane modules with integrated aeration in this duty class typically run at 0.6–0.8 m³/m²·d with an MLSS of 8,000–12,000 mg/L, an operating envelope that is now considered routine rather than experimental.
Driver 6: Asia-Pacific Capacity Buildouts Reshape Global Supply
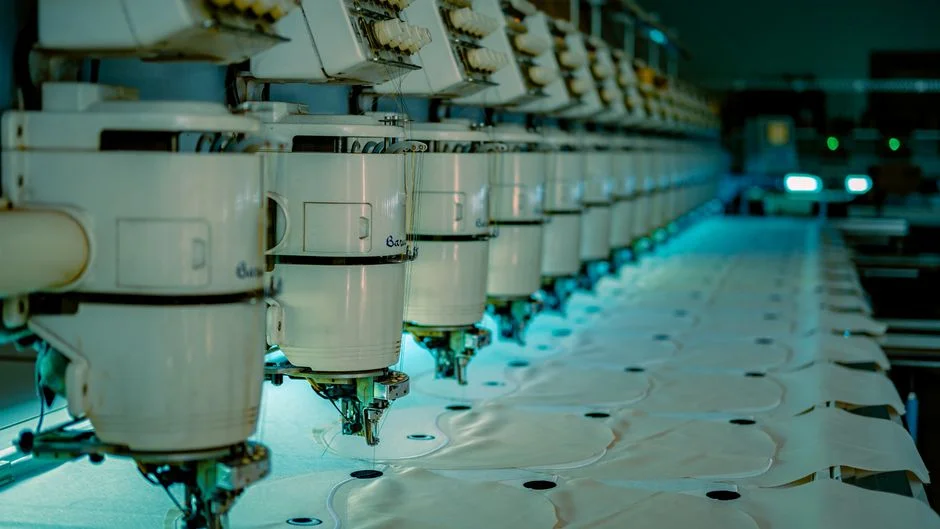
TrendForce's 2026 top-10 tech trend report (Nov 2025) flagged APAC as the geographic engine for 2026 membrane demand, driven by China's 14th Five-Year Plan water section, India's Smart Cities wastewater program, and Vietnam's textile-export ZLD rules. That regional pull has direct consequences for Western buyers: 2026 lead times for spiral-wound RO elements from the two dominant Japanese suppliers extend to 16–24 weeks, while ceramic elements from APAC suppliers are now competitively stocked in European and Gulf warehouses to cut that lead time to 6–10 weeks.
The procurement response in 2026 is structural. EPCs are qualifying second-source Asian membrane suppliers — both polymeric spiral-wound and ceramic — to mitigate supply concentration in the DuPont/Toray duopoly and to capture 5–10% element cost savings on long-frame supply agreements. Wastewater treatment plant sourcing in Sharjah and the Gulf region documents the same shift at the plant-builder level: Gulf EPCs that once specified European membranes exclusively are now running dual-source qualification on APAC supply for 2026–2027 project pipelines.
Driver 7: AI-Driven Fouling Control and Predictive Membrane Maintenance
Software is now a meaningful part of the 2026 membrane value proposition. Leading MBR and RO suppliers bundle ML-based CIP prediction and flux optimization as standard, not as premium add-ons. The OPEX impact is documented rather than speculative: AI-driven aeration control on submerged MBRs delivers 15–25% energy savings versus fixed-DO setpoints, per 2024–2025 case studies from Suez and Veolia pilot sites, and CIP chemical consumption drops 20–30% when ML extends membrane runtime between cleanings (HydropureWater field-data aggregation, 2026). Those numbers directly improve membrane replacement economics because every avoided CIP cycle adds back 1–3% of effective element life.
Predictive maintenance is a 2026 procurement requirement, not a 2028 option, and the cost benchmarks are now publishable. Predictive maintenance cost benchmarks for 2026 put the per-membrane-train ML instrumentation package at $18,000–45,000 capex for a 50–200 m³/day plant, with payback inside 18 months on energy and chemical savings alone. Machine-learning optimization pricing in wastewater 2026 documents the broader smart-plant trend and the per-tag, per-sensor cost structure that an EPC needs to budget in 2026.
2026 Membrane Market: Driver Impact at a Glance
Five of the seven drivers cluster in the 0–2 year action window. That is why 2026 is the procurement year for industrial membrane CAPEX, not 2028.
| Driver | 2026 evidence | Impact on membrane demand | Time horizon |
|---|---|---|---|
| PFAS and micropollutant regulations | EPA PFAS NPDWR compliance 2027–2029; EU UWWTD recast 2024 | High | 0–2 years |
| Industrial water reuse mandates | China 2022–2025 reuse policy; India EPR 2025; >85% reuse at new semi fabs | Medium-High | 0–2 years |
| ZLD default for new plants | China/India ZLD enforcement from 2024; DTRO at 70,000 mg/L TDS | High | 0–2 years |
| Ceramic cost-curve crossing | 30–40% element price drop since 2021; 4+ APAC suppliers quoting 2026 delivery | Medium | 2–5 years |
| Energy-efficient MBR designs | 0.3–0.5 kWh/m³ submerged PVDF; 60% footprint reduction vs. CAS | Medium | 2–5 years |
| APAC capacity buildouts | TrendForce 2026 top-10 trend; 16–24 week RO lead times; dual-source qualification | High | 0–2 years |
| AI fouling control | 15–25% aeration savings; 20–30% CIP chemical reduction (Suez, Veolia pilots, 2024–2025) | Medium | 2–5 years |
Translating Market Drivers into 2026 Equipment Selection
The market drivers above resolve into four practical decision rules for 2026 CAPEX.
| If the site has this signal | Then specify this membrane configuration |
|---|---|
| PFAS, pharmaceutical residues, or other regulated micropollutants in influent | High-rejection RO or tight NF, 4-inch or 8-inch elements rated for 99.5%+ NaCl rejection, paired with GAC polishing |
| Influent TDS >5,000 mg/L or ZLD mandate in force | DTRO train with concentrate route to crystallizer; operating pressure 70–120 bar |
| 10–2,000 m³/day flow with reuse-grade effluent target | Submerged MBR with PVDF flat-sheet membranes, 0.6–0.8 m³/m²·d flux, MLSS 8,000–12,000 mg/L |
| Stream >50 °C, oily, or chemically aggressive (pH 0–14 cleaning) | Ceramic UF or MBR with silicon-carbide or alumina elements, 10–15 year design life |
These four rules cover roughly 90% of the 2026 industrial WWTP membrane selection conversations HydropureWater is running with EPCs in chemicals, food, pharma, and electronics. The detail behind each rule, including the operating-envelope math, is the substance of the equipment-selection guides linked throughout this article.
2026–2028 Membrane Market Outlook and What to Watch
The total membrane technology market is projected to grow at 7–10% CAGR through 2030, with RO and MBR sub-segments leading, and the high-pressure RO / DTRO sub-segment outpacing both at 10–12%. Watch-list items for 2027–2028 are graphene-oxide membranes moving from lab to pilot, forward-osmosis for brine minimization in inland ZLD, and tighter EU PFAS limits expected in 2027 that will pull industrial demand forward. For 2026 buyers, the operational implication is to lock in long-term membrane supply agreements now: 2027 element pricing is expected to rise 5–10% as PFAS-driven demand outruns 2024 capacity additions, and multi-year supply contracts written in 2026 are the cleanest hedge against that move.
Frequently Asked Questions
What is driving the membrane technology market in 2026? Four drivers are doing most of the work: PFAS and micropollutant regulations moving from rule to enforcement, ZLD becoming the default for new industrial plants, industrial water reuse economics closing the 2–4 year payback window, and ceramic-membrane cost curves crossing the viability threshold for harsh streams. APAC capacity buildouts and AI-driven fouling control add supply-side and OPEX-side pressure on top of those four.
How fast is the membrane bioreactor (MBR) market growing? The MBR market is on a documented trajectory from $3.8 billion in 2024 to $5.8 billion by 2030, a CAGR of roughly 7.7%, with growth concentrated in industrial and water-reuse duty rather than greenfield municipal plants.
Are ceramic membranes cost-competitive with polymeric in 2026? Yes for high-TDS, oily, hot, or chemically aggressive streams, where the 10–15 year ceramic service life offsets a 2–3× higher unit capex. For standard municipal-grade duty, polymeric still wins on first cost.
Which industrial sectors are driving 2026 membrane demand? Semiconductors, pharmaceuticals, textiles and dyes, food and beverage, and battery manufacturing are the five highest-intensity sectors in 2026, in that order by membrane CAPEX share.
What is the best membrane technology for industrial wastewater in 2026? The honest answer is decision-tree logic: if the target is reuse, MBR + RO; if the target is ZLD, UF + BWRO + DTRO + crystallizer; if the stream is harsh, ceramic UF or MBR upstream of RO; if the target is PFAS compliance only, RO/NF with GAC polishing. There is no single winner across all four cases.