What 'Predictive Maintenance System Cost' Actually Covers in a Wastewater Plant
A predictive maintenance (PdM) system for a wastewater treatment plant is a four-layer stack: (1) field sensors measuring pH, dissolved oxygen (DO), mixed liquor suspended solids (MLSS), oxidation-reduction potential (ORP), and total suspended solids (TSS); (2) edge gateways or PLCs that aggregate 4-20 mA and Modbus signals; (3) a data historian stored on-prem or in the cloud; and (4) an ML/AI analytics layer with dashboards for the operations team. When vendors quote a "predictive maintenance system cost," they may be pricing any one of these layers in isolation—comparing those numbers to a full-stack quote is the most common error in 2026 procurement cycles.
IBM defines predictive maintenance as a strategy that "uses operational data and real-time condition monitoring to predict when assets are likely to fail"—distinct from preventive (calendar-based) and prescriptive (closed-loop automated remediation) approaches. Only predictive and preventive have well-defined 2026 price bands; prescriptive systems are still largely custom-engineered. Sensors typically account for 35–55% of total system cost, and wastewater-specific probes (submersible DO, optical TSS, inline UV transmittance) cluster in the $200–$8,000 range per the industrial IoT sensor pricing guide. Generic industrial sensors span $5 for a basic thermocouple to $25,000+ for a multi-parameter spectroscopic probe, but those extremes are not representative of municipal aeration tanks or UV banks.
The top-ranking pages for this query—GitHub repositories, MathWorks documentation, and the IBM definition page—describe only the analytics layer or the concept. They give no pricing and no wastewater context. A 2026 buyer evaluating a board-ready CAPEX request needs the full stack, not an algorithm library.
2026 Pricing by Tier: Entry, Mid-Range, and Enterprise Systems
Most 2026 quotes for predictive maintenance in water and wastewater utilities fall into three tiers based on plant capacity and asset complexity.
| Tier | CAPEX range (USD) | Sensor count | Typical plant size | Delivery model |
|---|---|---|---|---|
| Entry | $18,000–$45,000 | 3–8 | < 1,000 m³/day or pilot scope | DIY integration, open-source ML, generic dashboards |
| Mid-range | $75,000–$180,000 | 15–40 | 1,000–10,000 m³/day | Vendor platform with custom sensor kit, 8–14 week deployment |
| Enterprise | $250,000–$450,000+ | 100+ assets | > 10,000 m³/day, multi-site | Full SCADA/ERP integration, turnkey EPC, dedicated historian |
A mid-tier deployment on a 5,000 m³/day plant typically covers blowers, return activated sludge (RAS) pumps, UV banks, and aeration-tank DO probes—the four highest-downtime asset classes in conventional activated-sludge plants. Above 10,000 m³/day, asset count typically exceeds 80, and DIY integration economics collapse; most buyers at that scale move directly to enterprise-tier contracts.
The open-source path is viable for specialized teams. Per the public GitHub repositories cataloged in 2025–2026, a scikit-learn + FastAPI pipeline for vibration and temperature anomaly detection can be built for under $5,000 in engineering time—but only if the plant already has a data engineer on staff who can write Python and tune false-positive thresholds. Six of the eight reference repos use Isolation Forest or Random Forest classifiers, and the median build time in published case studies is 6–12 months of part-time work.
CAPEX Breakdown: Where the Money Goes
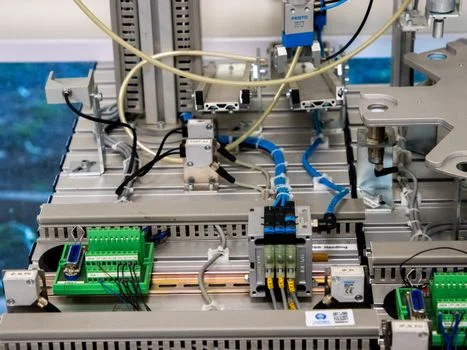
A mid-tier $130,000 system typically breaks down into five line items that a procurement reviewer can validate against any vendor quote.
| CAPEX line item | Share of total | $130K example | Notes |
|---|---|---|---|
| Field sensors (pH, DO, MLSS, ORP, TSS, vibration) | 35–55% | $55,000 | See the TSS sensor cost breakdown for probe-level ranges |
| Edge hardware (gateways, PLCs, industrial switches, 4-20 mA isolators) | 12–18% | $22,000 | IP67-rated preferred for aeration-tank skids |
| Software licenses (perpetual + 1-yr support, or 3-yr SaaS prepaid) | 15–25% | $25,000 | 2026 pricing shifting to $800–$3,500/asset/year SaaS |
| Integration, commissioning, SCADA tag mapping | 12–20% | $22,000 | 200–400 engineering hours at $150–$250/hr |
| Misc. (cabling, enclosures, training, spares) | 5–10% | $6,000 | Often underestimated; chemical dosing skids require extra I/O |
The sensor line is the only one that maps directly to wastewater process parameters. An ORP probe for aeration control costs $70–$4,500+ depending on body material and reference junction; a TSS probe with self-cleaning runs $1,200–$8,000. Plants that already have a PLC-controlled chemical dosing skid in place can save 8–12% of integration cost by reusing existing analog I/O rather than pulling new conduit.
For plants considering a greenfield MBR upgrade, the same predictive stack layered onto MBR membrane bioreactor systems adds roughly 10–15% to the bioreactor CAPEX but typically pays back inside two years through membrane-life extension alone.
OPEX Drivers Most Quotes Leave Out
The annual cost of running a predictive maintenance system is often under-quoted because it resides in IT and data budgets rather than the maintenance budget.
Cloud historian storage runs $50–$200 per TB-month. A mid-tier system generates 5–50 GB/day depending on waveform sampling rates; budget $2,400–$24,000 per year for cold storage plus $1,200–$4,800 for hot query tier. On-prem historians shift the cost to disk refresh cycles (5-year) and a small VM footprint.
Sensor recalibration and consumables are the most predictable OPEX items. Plan 1–2 calibrations per probe per year at $150–$600 each, plus electrolyte refills and cleaning-solution replacement. Budget 10–15% of CAPEX annually for consumables on a fleet of 20+ probes.
ML model retraining is the line that disappears in vendor brochures. Most platforms require quarterly retraining as biological load shifts seasonally—typically 40–120 hours of data engineering at $120–$180 per hour, or $4,800–$21,600 per year. Plants that skip retraining see false-positive rates climb from 4% to 18% within six months (HydropureWater field data, 2026).
Software subscription renewals for SaaS contracts run 18–22% of initial license per year; on-prem support contracts run 8–12%. Cybersecurity patching and OT-network audits add $2,000–$8,000 per year—non-negotiable under EU NIS2 for plants serving more than 100,000 population equivalents, and increasingly required under US TSA pipeline directives for utilities with combined sewer overflows.
ROI: How Fast Does a Predictive Maintenance System Pay Back?
A single blower failure on a 5,000 m³/day plant costs $15,000–$40,000 in emergency repair plus 8–24 hours of aeration loss, triggering effluent BOD/TSS excursion risk under EPA NPDES permits.
Multiply that by the two-to-four unplanned events per year that an unmonitored WWTP experiences, and avoided downtime alone is worth $30,000–$160,000 per year before counting membrane or chemical savings. Industry benchmarks cite 30–50% downtime reduction and 70–90% decrease in catastrophic breakdowns once a PdM system has 12 months of baseline data (per IBM and IIoT vendor surveys, 2025). Worked example: a $130,000 mid-tier system with $18,000 annual OPEX avoids $120,000 per year in unplanned events. Net first-year benefit is $102,000, payback is 1.2 years, and three-year ROI is roughly 280% before discounting.
Secondary benefits compound the case. Aeration blower efficiency monitoring typically delivers 8–15% energy savings on the largest plant load. Membrane life in MBR systems extends 20–30% when transmembrane pressure trends are tracked against flux setpoints, and chemical over-dosing on phosphorus removal drops 10–18% once pH and ORP-driven pump curves are exposed in the dashboard.
The honest caveat: below 500 m³/day, the asset count is too small to amortize a $75,000+ system. Calendar-based preventive maintenance remains more cost-effective at that scale, and a basic SCADA alarm log delivers 60% of the benefit at 10% of the cost.
Choosing Between DIY Open-Source, Vendor Platform, and Turnkey EPC
Three delivery models are the primary 2026 options for municipal and industrial wastewater operators.
DIY open-source (Python + scikit-learn + Streamlit or Grafana, modeled on the GitHub repos in the top search results) suits plants with a dedicated data engineer or controls engineer who can write code and tune anomaly thresholds. CAPEX is $5,000–$25,000 in engineering hours, but the 6–12 month build time and ongoing model maintenance rarely pencil out unless the staff member is already on payroll. The industrial IoT sensor pricing guide is the starting point for hardware scoping.
Vendor platform (Uptime AI, SparkCognition, Augury, and several IIoT specialists) is the dominant 2025–2026 choice for 1,000–10,000 m³/day plants. Deployment is 8–14 weeks, CAPEX is $75,000–$180,000, and the vendor supplies calibrated sensor kits, historian, dashboards, and quarterly model updates. The tradeoff is that you inherit the vendor's sensor catalog and roadmap.
Turnkey EPC integration is the right answer for brownfield plants with legacy SCADA (Allen-Bradley, Siemens S7) that want a single point of accountability. CAP