Missouri’s municipal sewage treatment plants face unique challenges: variable influent quality (e.g., 200–1,200 mg/L BOD in urban areas like St. Louis vs. 50–300 mg/L in rural Warrensburg), strict MoDNR nutrient limits (≤1 mg/L total phosphorus), and aging infrastructure (40% of plants are 30+ years old, per EPA 2023 data). This 2025 blueprint provides engineering specs for 1–50 MGD plants, cost breakdowns ($3.2M–$45M CAPEX), and a zero-liquid-discharge (ZLD) compliance roadmap—with real-world case data from Missouri City’s award-winning 20 MGD membrane plant.
Missouri’s Municipal Sewage Treatment Landscape: Key Challenges and Opportunities
Missouri’s wastewater infrastructure is currently at a critical juncture. According to the Missouri Department of Natural Resources (MoDNR) 2024 inventory, the state manages over 500 municipal treatment facilities. These plants serve approximately 6.2 million residents, with a sharp divide in operational requirements between the 60% of plants located in high-density urban centers like St. Louis and Kansas City, and the 40% serving rural populations. For municipal engineers, the primary challenge lies in managing influent variability. Urban plants, such as those situated along the Missouri River, often process up to 30% industrial cooling wastewater, which introduces high thermal loads and specific chemical profiles. Conversely, rural plants like those in Warrensburg face seasonal spikes in Biological Oxygen Demand (BOD) and Total Suspended Solids (TSS) due to agricultural runoff and fluctuating populations in college towns.
Regulatory pressure from the EPA Region 7 and MoDNR is intensifying. The 2025 nutrient limits mandate stringent Total Phosphorus (TP) levels of ≤1 mg/L and Total Nitrogen (TN) levels of ≤10 mg/L for most major dischargers. new 2024 EPA guidelines have introduced mandatory PFAS monitoring, targeting limits as low as 4 ng/L for PFOA/PFOS. With 40% of Missouri’s plants exceeding a 30-year operational life, the risk of non-compliance is high; the 2022 EPA Clean Watersheds Needs Survey identified that 15% of the state’s facilities are currently at risk of failing to meet updated discharge permits.
To bridge the funding gap, Missouri offers several robust financial mechanisms. The Missouri Clean Water State Revolving Fund (SRF) provides low-interest loans (typically around 1.5%) for plant upgrades. Additionally, USDA Rural Development grants can cover up to 75% of project costs for smaller municipalities. Navigating these funding sources requires a detailed engineering report and an environmental assessment, which typically takes 6 to 12 months to clear MoDNR review.
| Parameter | Urban Missouri Plants (e.g., St. Louis) | Rural Missouri Plants (e.g., Warrensburg) |
|---|---|---|
| Primary Influent Source | Residential + 30% Industrial/Cooling | Residential + Agricultural Runoff |
| Typical Flow Range | 20 – 150+ MGD | 0.5 – 5.0 MGD |
| Avg. BOD Influent | 400 – 1,200 mg/L | 150 – 350 mg/L |
| Infrastructure Age | 35+ Years (Avg.) | 25+ Years (Avg.) |
| Primary Funding | SRF Loans / P3 Partnerships | USDA Grants / SRF Loans |
Engineering Specifications for Missouri Municipal Plants: Influent, Process, and Effluent Parameters
Designing a municipal plant in Missouri requires a rigorous understanding of local influent characteristics. Data from the MoDNR 2024 permit database indicates that Missouri influent ranges are significantly broader than national averages. BOD levels can fluctuate between 50 mg/L during heavy rain events (due to inflow and infiltration) to 1,200 mg/L in industrial corridors. Phosphorus levels are particularly high in regions with heavy agricultural presence, ranging from 3 to 15 mg/L, necessitating advanced biological or chemical removal strategies.
The standard process flow for a modern Missouri facility follows a multi-stage approach: influent screening, primary clarification, biological treatment, secondary clarification, disinfection, and sludge handling. For plants discharging into sensitive watersheds, such as the Lake of the Ozarks or the Missouri River, the selection of biological treatment technology is paramount. Conventional Activated Sludge (CAS) remains the baseline for rural areas due to lower initial costs, but Membrane Bioreactor (MBR) systems are increasingly favored for their ability to meet the ≤1 mg/L TP limit without tertiary filtration. MBR systems for nutrient-sensitive Missouri plants offer 99% pathogen removal and a footprint up to 50% smaller than CAS systems.
| Parameter | Influent Range (MoDNR Data) | MoDNR Target Effluent | EPA Secondary Standards |
|---|---|---|---|
| BOD5 | 50 – 1,200 mg/L | ≤10 mg/L | ≤30 mg/L |
| TSS | 100 – 800 mg/L | ≤15 mg/L | ≤30 mg/L |
| Ammonia (NH3-N) | 10 – 50 mg/L | ≤1.5 mg/L (Seasonal) | N/A |
| Total Phosphorus | 3 – 15 mg/L | ≤1.0 mg/L | N/A |
| E. coli | 10^5 – 10^7 CFU/100mL | ≤126 CFU/100mL | N/A |
Disinfection strategies must also align with Missouri-specific pathogen limits. While chlorine gas was historically dominant, many Missouri cities are transitioning to UV or Chlorine Dioxide to avoid the formation of disinfection byproducts (DBPs). UV systems require a dose of 20–40 mJ/cm² to meet the E. coli limit of ≤126 CFU/100mL, whereas chlorine dioxide generators provide excellent residual control for plants with long outfall lines. For more detail on these technologies, consult this guide on Missouri-specific disinfection options (chlorine, UV, ClO₂).
Equipment Selection Guide: Matching Technology to Missouri’s Plant Needs
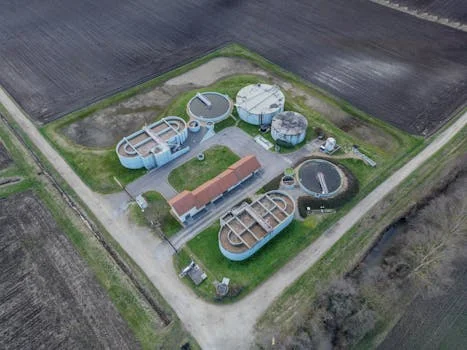
Procurement managers must select equipment that balances high removal efficiency with operational simplicity. In Missouri’s urban centers, where industrial solids are prevalent, high-solids screening for industrial influent using rotary drum screens (GX Series) is essential. These systems utilize 1–6 mm mesh to achieve 85–95% TSS removal in the primary stage, significantly reducing the organic load on downstream biological processes.
For clarification, underground systems for space-constrained Missouri plants, such as lamella clarifiers, are increasingly popular. These units operate at surface loading rates of 20–40 m/h, allowing for a much smaller footprint than conventional circular clarifiers (which require 30–50 m/h but much larger surface areas). This is particularly advantageous for Missouri cities where land acquisition is costly or restricted by existing urban infrastructure.
Sludge management represents a significant portion of OPEX. In Missouri, landfill disposal costs range from $40–$80/ton, while land application (biosolids) costs $20–$50/ton. To minimize these costs, plants are moving toward plate-and-frame filter presses, which can achieve 30–50% cake solids compared to the 18–25% typically produced by belt presses. For disinfection in large municipal networks like Kansas City, chlorine dioxide for residual control in long distribution systems ensures that bacterial regrowth is inhibited without the safety risks associated with bulk chlorine gas storage.
| Equipment Category | Recommended Technology | Key Performance Metric | Missouri Application |
|---|---|---|---|
| Primary Screening | Rotary Drum (GX Series) | 85-95% TSS Removal | Urban/Industrial Influent |
| Clarification | Lamella Plate Settlers | 20-40 m/h Loading Rate | Space-constrained plants |
| Biological | MBR (0.1 μm Membrane) | 99% Pathogen Removal | Sensitive Watersheds |
| Dewatering | Plate & Frame Press | 30-50% Cake Solids | High Landfill Cost Areas |
Cost Breakdown for Missouri Municipal Plants: CAPEX, OPEX, and ROI Calculators
Budgetary transparency is vital for securing city council approval. Based on 2023 EPA Needs Survey data and recent Missouri SRF projects, CAPEX for a new or significantly upgraded plant ranges from $3.2M for a 1 MGD facility to $45M for a 50 MGD plant. These figures include engineering design (10-15%), equipment procurement (30-40%), and civil construction (45-50%).
OPEX is driven primarily by energy consumption, which accounts for 30–40% of the annual budget. For a typical 10 MGD plant in Missouri, annual OPEX ranges between $800,000 and $1.2 million. To mitigate these costs, many engineers are integrating automated chemical dosing for cost savings, which can reduce polymer and coagulant consumption by 20–30%. Automated systems ensure that chemicals are only added when sensors detect a rise in influent concentration, preventing the common "over-dosing" seen in manual operations.
The ROI for these upgrades is often realized through three channels: MoDNR nutrient credits ($0.50–$2.00/lb of TP removed), water reuse savings for municipal irrigation ($0.80–$1.50/kgal), and the avoidance of MoDNR non-compliance fines, which can reach $50,000 per violation. For a detailed breakdown of how these factors influence long-term financial viability, see our ROI calculators for Missouri plant upgrades.
| Plant Capacity (MGD) | Estimated CAPEX (2025 USD) | Annual OPEX (Avg.) | Typical ROI Period |
|---|---|---|---|
| 1 – 5 MGD | $3.2M – $8.0M | $150K – $400K | 8 – 12 Years |
| 10 – 20 MGD | $12M – $25M | $800K – $1.5M | 6 – 10 Years |
| 30 – 50 MGD | $30M – $45M | $2.5M – $4.0M | 5 – 8 Years |
Missouri Compliance Roadmap: Permits, Monitoring, and Zero-Liquid-Discharge (ZLD) Strategies
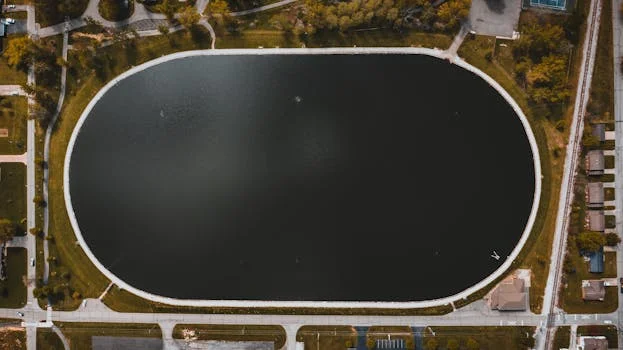
The path to compliance in Missouri involves a strict sequence of MoDNR reviews. The permitting process begins with an Engineering Report (ER) that must be signed by a Missouri-licensed P.E. Following the ER approval, a construction permit is issued, which includes a 30-day public comment period. Continuous monitoring is the standard for 2025; this includes real-time pH and flow meters, weekly BOD/TSS testing, and quarterly nutrient sampling. EPA Region 7 has also signaled that PFAS screening will become an annual requirement for all municipal dischargers serving populations over 10,000.
Zero-Liquid-Discharge (ZLD) is becoming a viable strategy for Missouri cities looking to future-proof their operations against tightening discharge limits. ZLD typically involves an MBR system followed by reverse osmosis for high-TDS industrial influent. This combination allows the plant to recycle 90-95% of its effluent for non-potable uses, such as industrial cooling or landscape irrigation. In Kansas City, a 1.5 MGD reuse system already demonstrates the feasibility of this approach, significantly reducing the volume of treated water discharged into the Missouri River and lowering the risk of nutrient-related permit violations.
Case Study: Warrensburg, MO’s Dual-Plant Operation – Lessons for Missouri Cities
Warrensburg, Missouri, provides a compelling example of managing modern wastewater challenges with limited resources. The city operates two mechanical plants—a 1.2 MGD facility and a 0.8 MGD facility—serving 20,000 residents and the University of Central Missouri. For years, the city struggled with 40-year-old clarifiers and seasonal spikes in influent BOD (often reaching 400 mg/L) during the academic year.
To address these issues and meet MoDNR’s ≤1 mg/L TP limit, Warrensburg implemented a phased upgrade. They replaced aging secondary clarifiers with an MBR system and installed energy-efficient turbo blowers. By integrating automated chemical dosing for phosphorus precipitation, the city achieved a 20% reduction in chemical costs. The results were immediate: a 95% compliance rate with all MoDNR permits and an annual OPEX saving of approximately $120,000. Perhaps most importantly, the city partnered with MU Extension to provide specialized operator training, ensuring that the new, complex membrane systems were maintained at peak efficiency. This proactive maintenance schedule has extended the membrane life by an estimated 25%, providing a roadmap for other mid-sized Missouri cities facing similar infrastructure hurdles.
Frequently Asked Questions
What are the Missouri-specific nutrient limits for sewage treatment plants?
As of 2025, MoDNR generally requires ≤1 mg/L total phosphorus (TP) and ≤10 mg/L total nitrogen (TN). However, plants discharging into "sensitive" watersheds, such as the Lake of the Ozarks or the Shoal Creek basin, may face stricter limits as low as 0.5 mg/L TP.How much does a 10 MGD municipal sewage treatment plant cost in Missouri?
The CAPEX for a 10 MGD plant typically ranges from $12M to $20M, depending on the complexity of the influent and the required treatment level. Annual OPEX for a plant of this size averages $1M to $1.5M, with energy and labor being the primary drivers.What are the best treatment technologies for Missouri’s variable influent quality?
For nutrient-sensitive areas, MBR systems are the gold standard due to their 0.1 μm filtration. For rural plants with tighter budgets, Sequencing Batch Reactors (SBR) offer a good balance of nutrient removal and lower CAPEX. For plants with high industrial FOG (Fats, Oils, and Grease), DAF systems are recommended for primary treatment.What funding options are available for Missouri municipal plants?
The Missouri Clean Water State Revolving Fund (SRF) offers 1.5% interest loans with 20-year terms. The USDA Rural Development program provides grants and loans for communities with populations under 10,000. Some larger cities are also exploring Public-Private Partnerships (P3) to spread the CAPEX burden.How can Missouri plants achieve zero-liquid-discharge (ZLD)?
Missouri facilities can achieve ZLD by combining MBR treatment with Reverse Osmosis (RO) and evaporation/crystallization for the brine stream. This is most effective in industrial-heavy municipalities where water can be recycled back to factories for cooling or process water.