MBR vs CAS Energy Footprint Comparison
An MBR vs CAS energy footprint comparison puts MBR at 0.8–1.2 kWh/m³ from air scour with about 60% less footprint than CAS. Permeate holds TSS below 1 mg/L and BOD below 5 mg/L; capital runs 30–50% higher.
Selecting the right train means balancing permit limits against land and OPEX. MBR is the primary pick when space is the binding constraint; relative footprint is about 1.0x versus about 2.5x for CAS in like-for-like industrial designs. For reuse or cooling-tower make-up, MBR permeate routinely holds BOD below 10 mg/L and TSS near zero. That clarity reduces the need for a separate tertiary filter before reverse osmosis.
From a compliance view, MBR typically reaches 99%+ TSS removal and about 92–97% COD removal under stable MLSS control. CAS often lands near 90–95% TSS, and MBBR near 85–92% COD, in comparable industrial duty. Most plants we size for high organic load keep influent COD under about 5,000 mg/L on the MBR feed after equalization. CAS trains above about 3,000 mg/L often need more equalization to limit bulking.
Longer SRT in MBR also cuts waste sludge about 30–50% versus short-SRT CAS, which lowers dewatering and haul cost over the asset life. For projects comparing only sludge systems, an earlier mrb vs ivcs comparison remains a useful companion read.
| Decision Driver | MBR (Membrane Bioreactor) | CAS (Conventional Sludge) | MBBR (Biofilm Reactor) |
|---|---|---|---|
| Footprint Requirement | Minimal (1.0x) | Extensive (2.5x) | Moderate (1.5x) |
| Effluent Quality (TSS) | <1 mg/L (99%+) | 15–30 mg/L (90–95%) | 20–40 mg/L (85–90%) |
| Water Reuse Potential | High (Direct Reuse) | Low (Requires Tertiary) | Moderate (Requires Filtration) |
| Sludge Production | Low (Long SRT) | High (Short SRT) | Moderate |
| Load Stability | High (Resistant to shocks) | Moderate (Sensitive) | Very High (Biofilm resilience) |
MBR vs MBBR vs CAS vs SBR: Process Mechanisms and Engineering Parameters
MBR systems couple biological oxidation with physical membrane separation, commonly PVDF membranes at 0.1–0.4 μm pore size in place of secondary clarifiers. That barrier supports Mixed Liquor Suspended Solids (MLSS) of 8,000–12,000 mg/L, versus 2,000–4,000 mg/L in CAS. Higher biomass density shortens Hydraulic Retention Time (HRT) to about 4–8 hours while Sludge Retention Time (SRT) stays about 15–30 days. Those conditions favor nitrifiers and slow-growing degraders of complex organics.
Moving Bed Biofilm Reactors (MBBR) grow biomass on plastic carriers with protected surface area around 300–500 m²/m³. Unlike MBR or CAS, MBBR skips return activated sludge because the biofilm stays on the media. Operation is simpler, but solids still need a clarifier or DAF, so effluent clarity is lower than membrane permeate. Sequencing Batch Reactors (SBR) run fill-and-draw cycles in one tank. They handle nitrogen well through timed anoxic/oxic phases, yet they are sensitive to peak-flow swings and need tight automation.
By definition, membrane bioreactors combine microfiltration or ultrafiltration with a biological wastewater treatment step, and for the most part hollow fiber and flat sheet configurations dominate industrial practice (Wikipedia, Membrane bioreactor). Operating at higher MLSS than gravity-settling systems is exactly what shrinks reactor volume for the same loading rate. Commercial membranes are commonly specified for five years of chemical and mechanical resistance, and PVDF is favored for long service life in chemically aggressive CIP duty.
| Engineering Parameter | MBR | MBBR | CAS | SBR |
|---|---|---|---|---|
| MLSS (mg/L) | 8,000–12,000 | N/A (Biofilm) | 2,000–4,000 | 3,000–5,000 |
| HRT (hours) | 4–8 | 3–6 | 6–12 | 12–24 (Cycle) |
| SRT (days) | 15–30 | 10–20 (Biofilm) | 5–15 | 10–20 |
| Separation Method | Membrane (0.1–0.4 μm) | Clarifier/DAF | Secondary Clarifier | Quiescent Settling |
| Biomass Type | Suspended | Attached Growth | Suspended | Suspended |
A typical MBR train uses fine screening (<2 mm) to protect membranes, an anoxic zone for denitrification, an aerobic zone for carbon oxidation, and a membrane tank where permeate is drawn by suction. MBBR skips sludge recycle but needs media retention screens. CAS and SBR rely on gravity settling, so tank volume grows to give flocs time to settle compared with the absolute solids barrier of a membrane.
How does MBR hold under peak flows?
Membrane bioreactor effluent quality stays stable under peak flows when membranes remain wet and instantaneous flux stays inside design limits. According to the US EPA Membrane Bioreactors Fact Sheet, peak design flows should stay within about 1.5–2 times average design flow. Beyond that limit, the fact sheet is direct: either additional membranes are needed simply to process the peak flow, or equalization should be included. High solids stay in the reactor because the membrane, not a clarifier blanket, retains biomass. Temporary biological upsets rarely spike TSS in the permeate.
EPA's Traverse City, Michigan case is the worked peak-flow example. That plant, the largest-capacity MBR facility in North America as of 2006, was built with a design average annual flow of 7.1 mgd, a maximum monthly flow of 8.5 mgd, and a peak hourly flow of 17 mgd. Peak hourly capacity of 17 mgd against a 7.1 mgd average is roughly 2.4 times, above the 1.5–2 screen, so the extra membrane area and equalization were engineered in rather than assumed. Over January-to-August sampling, its mixed liquor suspended solids averaged 6,400 mg/L.
Stable flux and quick recovery depend on screening, scour air, and TMP control. Dual-stage fine screens at about 1–3 mm (hollow-fiber often 1–2 mm; flat-plate often 2–3 mm per EPA guidance) cut ragging risk before the modules. When TMP rises, automated backwash or chemically enhanced backwash restores flux without waiting for a full CIP. Most plants we commission hold a spare membrane train so one cassette can be offline while peak hydraulic load continues.
MBR vs SBR Effluent TSS BOD Data

MBR vs SBR effluent TSS BOD data put MBR permeate below 1 mg/L TSS and below 5 mg/L BOD5, against an SBR band of 10–25 mg/L TSS and 10–20 mg/L BOD5. MBR provides a physical barrier to pathogens and suspended solids, commonly delivering about 6-log reduction for bacteria such as Escherichia coli without immediate tertiary disinfection. In industrial duty, where influent swings are common, solids stay inside the reactor even if biology dips. CAS and SBR secondary effluent more often sits near 15–30 mg/L TSS because gravity settling has inherent carryover risk.
US EPA case studies in the Membrane Bioreactors Fact Sheet back those bands with plant data. Calls Creek, Georgia, an early submerged install, ran effluent BOD and TSS around the detection limit, near 1 mg/L on both. Cauley Creek, Georgia, a 5-mgd wastewater reclamation plant, averaged 2.0 mg/L BOD, 12 mg/L COD, and 3.2 mg/L TSS with 0.1 mg/L total phosphorus, and removal for all parameters was over 90 percent. Its effluent meets all permit limits and is reused for irrigation and lawn watering, which is the reuse duty MBR is bought for.
COD and BOD removal also benefit from longer sludge age. Longer SRT supports slow-growing specialists that attack recalcitrant industrial organics. MBR typically reaches about 92–97% COD removal, while MBBR often sits near 80–88% and CAS near 85–92% under similar industrial feeds. For nutrients, MBR and SBR integrate anoxic/oxic zones readily. MBR can hold Total Nitrogen below about 10 mg/L and Total Phosphorus below about 1 mg/L with limited coagulant. MBBR and CAS often need more chemical precipitation to match those numbers.
Chemical polishing can push phosphorus lower still; the Cauley Creek reclamation average of 0.1 mg/L TP shows what a reuse-grade MBR with chemical dosing delivers (US EPA). Most plants we sample after a biology dip still hold permeate TSS below 1 mg/L because the sheet, not the clarifier, is the barrier.
| Parameter | MBR Effluent | CAS Effluent | MBBR Effluent | SBR Effluent |
|---|---|---|---|---|
| TSS (mg/L) | <1 | 15–30 | 20–40 | 10–25 |
| BOD₅ (mg/L) | <5 | 10–25 | 15–30 | 10–20 |
| COD (mg/L) | 20–50 | 60–100 | 80–120 | 50–80 |
| Turbidity (NTU) | <0.2 | 5–10 | 8–15 | 3–7 |
| Pathogen Red. | 99.9999% (6-log) | 90–99% (1-2 log) | 90–95% (1 log) | 95–99% (2 log) |
Footprint, Energy, and Chemical Consumption: Engineering Trade-Offs
MBR's main trade-off for effluent quality is energy, typically 0.8–1.2 kWh/m³ of treated water. Coarse-bubble air scour under the modules creates turbulence that limits cake buildup on the membrane surface. By comparison, MBBR (0.3–0.6 kWh/m³) and CAS (0.4–0.8 kWh/m³) spend aeration mainly on biological oxygen demand. Independent industrial comparisons also cite MBR specific energy spanning about 0.8–1.5 kWh/m³ versus about 0.3–0.6 kWh/m³ for CAS when scour and higher MLSS are included (Aguato, 2026).
On footprint, MBR is the densest option at about 0.1–0.2 m² per m³/day of capacity when clarifiers are eliminated and MLSS stays high. Chemical use centers on Cleaning-in-Place: every 3–6 months, membranes see sodium hypochlorite for organic fouling and citric acid for inorganic scale. CAS and MBBR skip membrane CIP chemicals but often burn more polymer and coagulant for clarification and sludge thickening. That chemical load can offset part of the CIP gap.
| Operational Metric | MBR | MBBR | CAS | SBR |
|---|---|---|---|---|
| Energy (kWh/m³) | 0.8–1.2 | 0.3–0.6 | 0.4–0.8 | 0.5–1.0 |
| Footprint (m²/m³/d) | 0.1–0.2 | 0.2–0.4 | 0.3–0.5 | 0.3–0.6 |
| Sludge (kg TSS/kg BOD) | 0.1–0.2 | 0.2–0.4 | 0.3–0.5 | 0.2–0.4 |
| Chemical Focus | Membrane CIP | Coagulants | Flocculants | Disinfectants |
To cut fouling energy, modern trains use intermittent scour and TMP-triggered cleans. When TMP crosses the set point, the PLC starts a backwash or chemically enhanced backwash so flux recovers before a full recovery clean is needed.
Air scour, not biological oxygen demand, drives an MBR vs CAS energy footprint comparison at industrial MLSS. According to Jun, Aghasadeghi, and Daigger (2024), scour air in the MBR tank is a controllable variable accounting for approximately one third of total energy consumption at full-scale plants. Their required air-flow estimates ran as little as 31 to 40 percent of the actual quantity of air used, across two municipal trains sampled from 1 July 2022 to 15 August 2023. Those plants ran MLSS of 3.8–7.0 g/L and 5.0–8.5 g/L, below the 8,000–12,000 mg/L band used for most industrial designs, so scour tuning matters even more at food and textile plants.
US EPA measured the same line directly at Traverse City: the energy use for the air-scouring blowers averaged 1,800 kW-hr per million gallons treated. Dividing 1,800 kWh by 3,785 m³ per million gallons gives about 0.48 kWh/m³ for scour alone, before biological aeration. That single line explains most of the gap between the MBR 0.8–1.2 kWh/m³ band and the CAS 0.4–0.8 kWh/m³ band in the table above. Most plants we size for oily industrial feed therefore stay at the high end of 0.8–1.2 kWh/m³.
What does a membrane bioreactor cost?
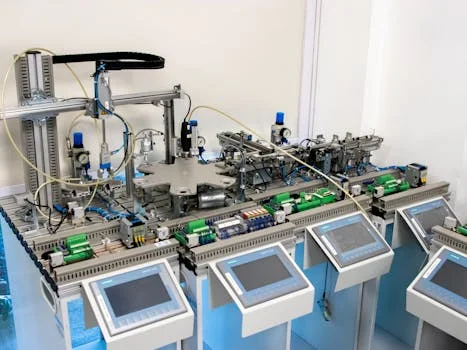
Membrane bioreactor cost on a CAPEX basis is generally higher than CAS or MBBR, with industrial benchmarks around $1,500–$3,000 per m³/day of capacity. That range covers membrane modules, stainless aeration manifolds, and permeate pumps. Mid-complexity industrial comparisons also cite installed MBR CAPEX near $800–$1,500 per m³/day versus about $400–$800 for CAS without tertiary polishing (Aguato, 2026). MBR Membrane Bioreactor Wastewater Treatment System packages cut field labor with modular skids. CAS CAPEX often sits near $500–$1,200/m³/day but needs more concrete for large tanks and clarifiers.
Membrane Bioreactor vs CAS OPEX Lifecycle Cost
Membrane bioreactor vs CAS OPEX lifecycle cost favors CAS on a standard secondary permit, and can favor MBR once land, sludge haul, or reuse water is priced in. OPEX for MBR typically runs about $0.30–$0.60/m³ for energy, chemicals, and labor. Membrane replacement is the periodic spike: PVDF flat-sheet modules often last 5–10 years at about $50–$100/m². Hollow-fibre replacement in recent industrial comparisons is often quoted nearer $20–$40/m² over a similar 5–10 year life (Aguato, 2026). A 10-year view for a 1,000 m³/day plant can still favor MBR when land price and sludge fees are high, or when reuse water displaces purchased makeup.
US EPA's fact sheet is blunt about where the money sits: the key to the cost-effectiveness of an MBR system is membrane life. Vendor warranties in that fact sheet run from 3 to 5 years up to 10 years, and longer membrane warranties are granted when smaller screens are used. Screen selection therefore changes both the replacement schedule and the warranty paper behind it. For regional CAPEX and compliance context, see the regional MBR implementation guides for compliance and cost analysis.
A line-item buyer view of modules and tanks is covered under typical costs for a membrane bioreactor system. Most plants we cost at 1,000 m³/day still see the membrane replacement line, not the daily blower, as the year-7 cash spike.
| Cost Factor (1,000 m³/d) | MBR | CAS | MBBR |
|---|---|---|---|
| Initial CAPEX | $1.5M – $3.0M | $0.5M – $1.2M | $0.8M – $1.5M |
| Annual OPEX | $110k – $220k | $75k – $145k | $55k – $110k |
| Membrane Repl. (5-10yr) | $150k – $300k | N/A | N/A |
| Sludge Disposal Cost | Low | High | Moderate |
| 10-Year Total Cost | $2.8M – $5.5M | $1.3M – $2.7M | $1.4M – $2.8M |
Are flat-sheet MBR membranes backwashable?
Backwashable flat-sheet MBR membranes are less common than hollow-fibre designs that use timed permeate back-pulse. According to the US EPA Membrane Bioreactors Fact Sheet, back-pulsing is typically done on a timer, with the pulsing time accounting for 1 to 5 percent of total operating time in major hollow-fibre systems. Flat-plate systems rely mainly on continuous or intermittent air scour plus chemical CIP. In practice, flat-sheet recovery still uses NaOCl and citric acid CIP every few months.
Operators should not assume reverse-flow backwash capability unless the module datasheet states it. Flat-plate construction generally cannot take reverse pressure without risking the cassette, so the procurement line to check is whether the module allows back-pulse at all, and at what maximum TMP. Where back-pulse is absent, flux recovery falls to the CIP schedule, which makes screening quality and scour-air stability the real protection for flat-sheet trains.
Selection checklist before you freeze the process design:
- Confirm effluent TSS, BOD, TN, and TP limits, including any reuse or RO feed specs.
- Map available footprint and land value against clarifier and tertiary needs.
- Measure peak-to-average flow; keep peaks within about 1.5–2× average or add equalization.
- Size fine screens (about 1–3 mm) and FOG pretreatment before membranes.
- Model energy at local tariffs using 0.8–1.2 kWh/m³ for MBR versus 0.3–0.6 for MBBR.
- Budget membrane replacement at year 5–10 and CIP chemical logistics.
- Assign O&M skill for TMP trending, integrity tests, and recovery cleans.
Use-Case Matching: Which Technology Fits Your Project?
MBR vs MBBR Industrial Wastewater Reuse Decision
An MBR vs MBBR industrial wastewater reuse decision picks MBR when permeate must feed reuse or reverse osmosis, and MBBR when the permit is secondary discharge on a simple organic load. Technology choice tracks industry and end use. Municipal plants on expensive land or discharging to sensitive receiving waters often standardize on MBR. Food, pharma, and textile plants with high-strength organics also lean MBR because high MLSS buffers batch shocks.
A deeper CAS-focused cost read is the sibling MBR vs Conventional Activated Sludge: 2026 Engineering Comparison. Keep the full-train frame, including pretreatment and reuse, not equipment price alone.
MBBR fits simpler industrial BOD duty—pulp and paper discharge without reuse—or CAS upgrades where media raises capacity inside existing tanks. High fats, oils, and grease streams, such as slaughterhouses, need DAF systems for pre-treatment of high-FOG industrial wastewater before biology so membranes do not foul and biofilm does not smother. Remote or staged projects can use modular treatment systems for space-constrained or scalable projects when deployment speed matters as much as effluent grade.
Reuse duty is where the membrane pays: permeate turbidity below 0.2 NTU and TSS below 1 mg/L feed reverse osmosis or cooling makeup with less pretreatment than filtered CAS effluent, as the Cauley Creek irrigation reuse case shows. Disinfection is still required downstream, because a membrane is a fine barrier, not an absolute one. Most plants we commission for cooling-tower makeup still put a turbidity meter on each train before the reuse pump.
| Project Requirement | Recommended Technology | Reasoning |
|---|---|---|
| Direct Water Reuse | MBR | Highest clarity and pathogen removal. |
| High FOG Influent | DAF + MBBR | Prevents membrane fouling; handles high loads. |
| Urban Retrofit | MBR | Smallest footprint per m³ treated. |
| Variable Flow/Load | SBR | Batch cycles adapt to flow fluctuations. |
| Low Budget Discharge | CAS | Lowest CAPEX and energy consumption. |
| Emerging Contaminants | MBR | Superior removal of microplastics and PFAS. |
Who this is for / Next step
Plant engineers and EPC teams use this comparison when reuse, footprint, or a strict TSS limit is on the table for an industrial or municipal biological train. Look elsewhere if you only need secondary discharge on cheap land with soft BOD/TSS limits—CAS or MBBR will usually win on lifecycle cost. If you already have influent COD, peak flow, and reuse targets, send them through a project sizing request so the membrane area, scour air, and pretreatment can be checked against your duty.
Frequently Asked Questions
What are the main disadvantages of MBR technology?
Higher capital cost, higher specific energy (about 0.8–1.2 kWh/m³), and fouling management are the main drawbacks for most industrial buyers. Air scour, TMP alarms, and CIP discipline are mandatory operating skills on every shift. Automated CIP and quality PVDF modules reduce downtime, but they do not erase the energy premium versus CAS or MBBR on discharge-only sites with cheap land.
Can MBR treat high-strength industrial wastewater?
Yes, MBR handles high-strength wastewater with influent COD up to about 5,000 mg/L when equalization and screening are correct. Above about 3,000 mg/L COD or with high oil, add pretreatment such as DAF systems for pre-treatment of high-FOG industrial wastewater before the membranes. FOG and grit control protect flux better than raising CIP frequency alone on oily batch plants.
How often do MBR membranes need replacement?
Well-maintained industrial PVDF flat-sheet membranes typically last 5–10 years under normal flux and cleaning discipline. US EPA's fact sheet records vendor warranties from 3 to 5 years up to 10 years, with longer membrane warranties granted when smaller screens are used. Life tracks fine-screen performance, CIP chemistry, and how often operators push flux above the design rate.
Is MBR more energy-efficient than CAS?
No. MBR usually uses more energy (0.8–1.2 kWh/m³) than CAS (0.4–0.8 kWh/m³) because of membrane air scour, which full-scale studies put near one third of total MBR energy. The gap can widen toward about 0.8–1.5 kWh/m³ for MBR in some industrial comparisons that include higher MLSS mixing. Offset comes from skipped tertiary filters, smaller hydraulic distances, and reuse water value—not from lower blower power on the membrane tank.
What industries benefit most from MBR?
Food and beverage, pharmaceuticals, textiles, electronics, and municipal plants in water-scarce regions benefit most when reuse or strict solids limits apply. Those sites value TSS below 1 mg/L and RO-ready turbidity more than the lowest possible CAPEX line item. Discharge-only greenfield plants with cheap land and soft permits usually stay with CAS or MBBR instead.
How much land does an MBR plant save versus CAS?
MBR typically needs about 60% less footprint than CAS, at roughly 0.1–0.2 m² per m³/day of capacity versus 0.3–0.5 for CAS trains. Eliminating secondary clarifiers and tertiary filters is where the plan area disappears, since MLSS of 8,000–12,000 mg/L shrinks biological volume for the same load. On expensive industrial land, that saved area often prices higher than the membrane premium. Run the land value into the lifecycle model before ruling MBR out.