
Soft Drink Wastewater Fingerprint: What Drives Technology Choice
Soft drink wastewater typically presents high sugar loads, with influent Chemical Oxygen Demand (COD) ranging from 3,000–8,000 mg/L, making a multi-stage treatment train essential for compliance (S3). This high organic content primarily stems from sugar, syrups, and flavorings. The Biochemical Oxygen Demand (BOD) to COD ratio often exceeds 0.4, indicating a highly biodegradable waste stream, similar to other food processing effluents (S3). pH variability is a critical factor, with swings from 3 to 11 common due to acidic or caustic cleaning-in-place (CIP) cycles and product changeovers, necessitating robust pH correction before biological treatment. Color, often from caramel, fruit juices, and tea extracts, also requires specific removal strategies; solar photo-Fenton processes have demonstrated 92% decolorization in 60 minutes for such effluents (S4, S5). Flow rates are typically variable, influenced by production shifts, seasonal peaks, and batch CIP discharges, which mandates adequately sized equalization tanks, often designed for 4–8 hours of hydraulic retention time (HRT). process heat can elevate wastewater temperatures to 25–40°C, a condition favorable for anaerobic pretreatment if influent COD consistently exceeds 5,000 mg/L.Four-Stage Treatment Train Design for Bottling Plants
A four-stage treatment train is required to manage typical soft drink wastewater, which includes high sugar loads (COD 3,000–8,000 mg/L) and pH variability (3–11) (S3). This structured approach addresses the specific challenges posed by beverage production.Stage 1 – Screening & Equalization: The initial stage involves mechanical screening, typically using a rotary bar screen with 2–6 mm openings, to remove packaging debris and other large solids. Following screening, a covered equalization tank with a hydraulic retention time (HRT) of 4–8 hours is critical to buffer flow and concentration variability. This tank also facilitates pH adjustment, using automated sulfuric acid (H₂SO₄) or sodium hydroxide (NaOH) dosing, to maintain a pH range of 6.5–7.5, which is optimal for subsequent biological processes.
Stage 2 – Primary Treatment (Coagulation-DAF): Primary treatment focuses on significant COD and suspended solids (SS) reduction. Chemical coagulation-flocculation followed by Dissolved Air Flotation (DAF) is highly effective. Polyaluminium chloride (PAC) at dosages of 500–700 mg/L (with 65% basicity) combined with cationic polyacrylamide (PAM) at 2–4 mg/L is dosed via an automatic chemical dosing system. This combination achieves 40–65% COD removal and approximately 80% SS removal (S3). A case study on frozen vegetable processing wastewater demonstrated 68% COD removal at 500 mg/L PAC (S3). DAF units are typically designed with a loading rate of 15–40 kg COD/m²·h for efficient separation. HydropureWater offers DAF systems for primary COD and SS removal.
Stage 3 – Biological Treatment: For bottling plants, an integrated MBR system for biological treatment is often recommended over conventional activated sludge (CAS) due to its smaller footprint and superior effluent quality. MBR systems operate with a high Mixed Liquor Suspended Solids (MLSS) concentration of 8,000–12,000 mg/L, a Solids Retention Time (SRT) of 20–30 days, and an HRT of 8–12 hours. This configuration achieves 85–95% soluble COD removal, producing an effluent with less than 50 mg/L COD, less than 5 mg/L BOD, and turbidity below 1 μm.
Stage 4 – Polishing & Disinfection: The final stage ensures compliance with stringent discharge limits. Granular activated carbon (GAC) is effective for removing trace organics and color, with regeneration costs around $0.15/m³ (S3 petrochemical case). Alternatively, for highly colored streams, solar photo-Fenton processes can achieve 94% mineralization (S4, S5). Final disinfection is typically achieved using UV systems or a chlorine dioxide generator for pathogen control.
| Treatment Stage | Key Equipment | Typical Parameters / Performance |
|---|---|---|
| 1. Screening & Equalization | Rotary Bar Screen, Equalization Tank, pH Dosing System | 2–6 mm screening, 4–8 hr HRT, pH 6.5–7.5 |
| 2. Primary Treatment (Coagulation-DAF) | PAC/PAM Dosing Skid, Flocculation Tank, DAF Unit | 500–700 mg/L PAC, 2–4 mg/L PAM, 40–65% COD removal (S3) |
| 3. Biological Treatment | MBR System (Aeration Tank, Membrane Modules) | MLSS 8,000–12,000 mg/L, HRT 8–12 hr, <1 μm effluent |
| 4. Polishing & Disinfection | GAC Filter OR Solar Photo-Fenton Reactor, UV/ClO₂ Generator | Trace organics/color removal, 94% mineralization (S4, S5), pathogen inactivation |
Equipment Sizing Parameters for 500–5,000 m³/day Plants
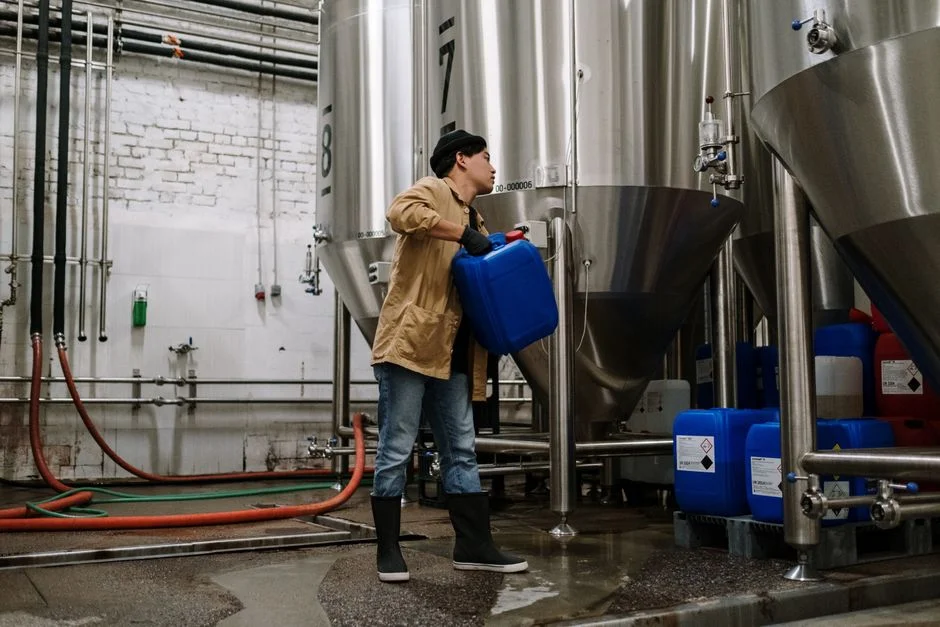
PAC/PAM Dosing System: For a 2,000 m³/day plant requiring 600 mg/L PAC and 3 mg/L PAM, the daily consumption would be 1,200 kg/day of PAC and 6 kg/day of PAM. A PLC-controlled PAC/PAM dosing skid should include storage silos with at least 30-day capacity to ensure supply continuity.
MBR Sizing: MBR systems are typically sized based on a membrane flux rate of 15–25 LMH (liters per square meter per hour). For a 2,000 m³/day plant operating at 20 LMH, the total required membrane area is 4,167 m². HydropureWater’s DF series flat-sheet MBR modules, with individual areas ranging from 80–225 m², would necessitate 19–52 modules. These systems often feature an integrated aeration box for membrane scouring.
Sludge Dewatering: Waste sludge from MBR systems typically has a solids content of 0.5–1.0%. A filter press for MBR sludge dewatering with a filtration area of 1–500 m² is suitable, targeting a cake solids content of 25–35%. Hydraulic loading rates for filter presses generally range from 5–15 L/m²·h.
GAC Polishing: Granular Activated Carbon (GAC) polishing systems are sized based on an empty bed contact time (EBCT) of 15–30 minutes. For a 2,000 m³/day flow, this translates to 21–42 m³ of carbon volume. On-site regeneration is typically required every 45 days, with costs around $0.15 per m³ (S3 petrochemical case).
| Equipment Type | Key Sizing Parameter | Calculation Example (2,000 m³/day) |
|---|---|---|
| DAF Unit | Hydraulic Loading Rate: 15–40 m³/m²·h | Required surface area: 2.1–5.5 m² |
| PAC Dosing System | PAC Dosage: 600 mg/L | Daily PAC consumption: 1,200 kg/day |
| PAM Dosing System | PAM Dosage: 3 mg/L | Daily PAM consumption: 6 kg/day |
| MBR System | Membrane Flux: 15–25 LMH | Required membrane area: 4,167 m² (at 20 LMH) |
| Sludge Filter Press | Hydraulic Loading: 5–15 L/m²·h | Target cake solids: 25–35% |
| GAC Polisher | Empty Bed Contact Time (EBCT): 15–30 min | Required carbon volume: 21–42 m³ |
MBR vs Conventional Activated Sludge: Decision Matrix for Beverage Wastewater
Membrane Bioreactor (MBR) systems offer a significantly smaller footprint, up to 60% less than conventional activated sludge (CAS) systems, making them advantageous for urban bottling plants with limited space (HydropureWater MBR spec). This space efficiency is a primary driver for MBR adoption in the beverage industry.Regarding effluent quality, MBR systems consistently produce permeate with less than 1 μm filtration, which is superior to the 10–30 mg/L TSS typically achieved by CAS systems. This high-quality effluent from MBR enables direct feed to reverse osmosis (RO) systems for water reuse, a critical consideration for water-intensive bottling operations. However, MBR systems operate with higher Mixed Liquor Suspended Solids (MLSS) concentrations (8,000–12,000 mg/L compared to 3,000–4,000 mg/L for CAS), resulting in less waste sludge volume but potentially higher dewatering costs due to the denser sludge.
From a cost perspective, MBR systems typically involve 20–35% higher equipment capital expenditure (CAPEX) than CAS. Operational expenditure (OPEX) for MBR is influenced by aeration energy for biological activity and membrane scouring, while CAS OPEX includes energy for secondary clarifiers and potential tertiary filtration. In terms of operational robustness, MBR systems generally handle flow and load variability more effectively due to their stable biomass retention. Conversely, CAS systems are often more tolerant of power outages because gravity settling in secondary clarifiers provides a buffer. For a detailed comparison, refer to our MBR vs conventional activated sludge blog or the MBR design guide for fermentation wastewater.
The decision rule is clear: choose MBR if footprint is constrained, water reuse is a planned objective, or discharge limits for TSS are stringent (<10 mg/L). Opt for CAS if land is readily available, lowest initial CAPEX is the primary priority, and discharge limits for TSS are more lenient (>30 mg/L).
| Feature | Membrane Bioreactor (MBR) | Conventional Activated Sludge (CAS) |
|---|---|---|
| Footprint | Up to 60% smaller (HydropureWater MBR spec) | Larger, requires secondary clarifier |
| Effluent Quality | <1 μm filtration, very low TSS | 10–30 mg/L TSS, requires tertiary filtration for reuse |
| Sludge Production | Higher MLSS (8,000–12,000 mg/L), less volume | Lower MLSS (3,000–4,000 mg/L), more volume |
| CAPEX | 20–35% higher equipment cost | Lower equipment cost |
| OPEX | Aeration + membrane scouring energy, membrane replacement | Aeration + secondary clarifier energy, tertiary filtration |
| Operational Robustness | Better for flow/load variability | More tolerant of power outages (gravity settling) |
CAPEX/OPEX Benchmarks and ROI Framework
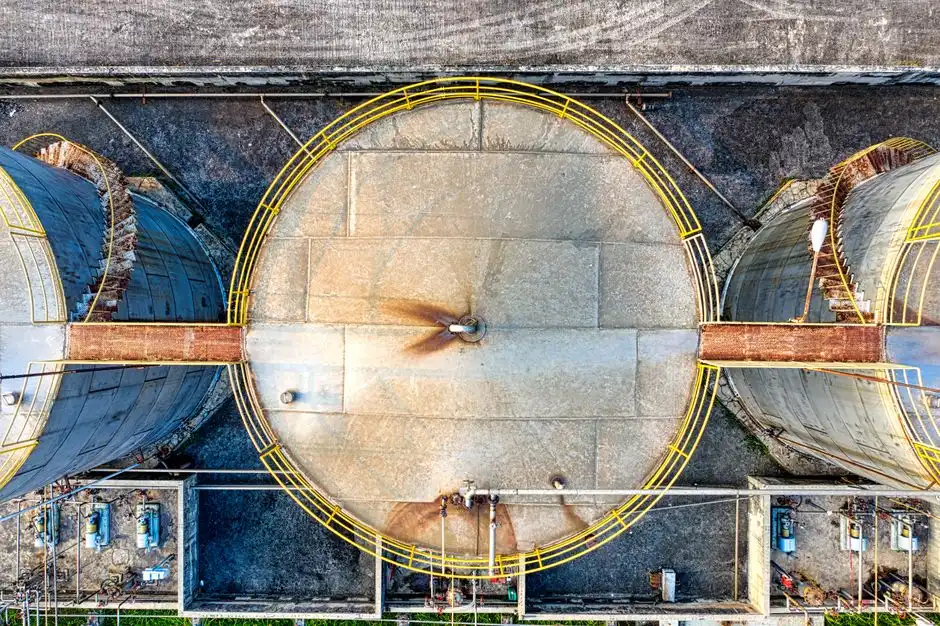
MBR system CAPEX for industrial applications in 2026 ranges from $1,200–1,800 per m³/day of capacity. For a 2,000 m³/day bottling plant, this translates to an equipment CAPEX of $2.4–3.6 million. Total OPEX for industrial wastewater treatment breaks down as follows (S3 percentages applied to beverage wastewater): chemicals 40–60% ($0.15–0.40/m³), energy 15–25% ($0.08–0.18/m³), sludge disposal 20–35% ($0.10–0.25/m³), and labor/maintenance 10–15%.
A significant return on investment (ROI) often comes from sewer surcharge avoidance. For instance, a facility discharging 2,000 m³/day with 3,000 mg/L COD into a municipal sewer that imposes a surcharge of $0.80/kg COD exceeding a 500 mg/L limit, would face annual surcharges of approximately $1.17 million without treatment. Achieving 85% COD removal could save nearly $1 million per year in surcharges, based on similar textile industry logic (S3). Payback periods for such investments are typically 11–18 months for bottling plants actively facing surcharges. Further value can be realized through water reuse, which can add $0.50–1.50/m³ in savings or revenue. More detailed cost breakdowns are available for specific technologies, such as the cavitation air flotation system cost guide and the chlorine dioxide generator cost guide.
Compliance Checklist and Vendor Evaluation Framework
Meeting regulatory discharge limits, such as the 50 mg/L COD for direct surface water discharge or 500 mg/L for municipal sewer discharge, requires a comprehensive permitting and vendor evaluation process (S3). It is essential to confirm all local discharge parameters, including BOD, TSS, color, and pH, as well as monitoring frequency and any specific toxicity testing requirements.When issuing a Request for Proposal (RFP) to vendors, ensure it mandates specific deliverables. This includes a detailed pilot testing protocol—e.g., jar tests for PAC/PAM optimization and MBR flux validation—to ensure the proposed solutions are effective for your specific soft drink wastewater. Vendors must provide performance guarantees, such as effluent COD consistently below 50 mg/L and TSS below 5 mg/L. Integration with remote monitoring and SCADA systems should be specified for operational control and data logging. Key equipment like MBR membranes should come with a warranty, typically 5–7 years, and vendors should confirm spare parts inventory availability. For a comprehensive review, consult a Coca-Cola ETP due diligence checklist.
Be wary of red flags during vendor selection: proposals that quote single-technology solutions for complex soft drink wastewater, vendors lacking specific pilot data for high-sugar effluents, claims of MBR membrane flux rates exceeding 25 LMH without robust scouring data, or chemical dosing systems without automatic pH feedback control. A typical project timeline involves 4–6 months for design and permitting, 3–4 months for fabrication, 2–3 months for installation and commissioning, followed by 1–2 months of performance validation. Further engineering specifications can be found in resources like the DAF sizing engineering specifications.