What the Anaerobic Digester Process Flow Diagram Shows
An anaerobic digester process flow diagram is a one-screen drawing that traces organic feedstocks, in the absence of oxygen, through a sealed reactor and out into two product streams — biogas and digestate. The U.S. EPA AgSTAR program describes the four functional blocks that every AD PFD must show: feedstock collection and co-digestion preparation, the digester/reactor vessel, biogas capture and treatment, and digestate handling (EPA AgSTAR, "How Does Anaerobic Digestion Work?").
Co-digestion appears as a single input node where manure, food waste, energy crops, crop residues and FOG are blended to lift gas yield (EPA AgSTAR). On an engineering deliverable, a PFD stops at streams, equipment symbols and major operating conditions; a P&ID layers in every instrument, control valve, safety interlock and pipe specification. For process engineers integrating an AD into an existing wastewater train, that distinction is where the PFD ends and the P&ID begins—a critical decision point for any P&ID reviewer.
Block 1: Feedstock Collection and Preparation
Feedstock collection and preparation provides the necessary upstream guard for the digester. Manure is collected in a way compatible with biogas recovery, and co-digestion substrates are delivered separately and prepared before mixing (EPA AgSTAR, "Anaerobic System Design and Technology"). Pretreatment is feedstock- and topology-dependent and typically includes size reduction, mixing and dilution to the target total-solids range; covered anaerobic lagoons require diluted manure with less than 3% total solids (RCM Digesters, 2018, as cited in PG&E's "Anaerobic Digestion Technical Analysis"). The PFD should also show the contaminant guard: feed additives carrying antibiotics and equipment-cleaning compounds such as detergents, acids and halogens are documented as harmful to the microbial community, even though full-scale digesters tolerate typical use because threshold levels have not been established (EPA AgSTAR). For an industrial wastewater context, this is where headworks screening belongs — a rotary mechanical bar screen for headworks screening protects the digester from rags, plastics and grit that would otherwise accumulate and starve the biology.
Block 2: The Digester Reactor and the Four Microbial Stages

Inside the sealed reactor, complex microbial communities break down organic matter without oxygen, with vessel shape and size tailored to site and feedstock (EPA AgSTAR). The PFD should annotate the four biochemical stages — hydrolysis, acidogenesis, acetogenesis and methanogenesis — because the symbol set and stream labels change between single-stage and multi-stage topologies. PG&E's "Anaerobic Digestion Technical Analysis" reports that single-stage systems run all four reactions in one vessel and reduce retention time to 3–5 days, while multi-stage systems split the stages across vessels to improve stability and gas yield at the cost of more equipment (USDA NRCS, 2007, as cited in PG&E). The feed regime also changes the diagram: a continuous-flow system shows a single feed-and-draw line pair, while a batch-flow system shows multiple parallel batch vessels with sequenced charge/discharge streams (PG&E). To visualize these stages, the diagram must accurately reflect the specific reaction kinetics of the chosen reactor type.
Block 3: Biogas Handling — Capture, Treatment, Storage and Use
Biogas exits the reactor through a piped head, where the only treatment required before combustion is usually moisture removal, though high-sulfur feeds necessitate H2S removal to protect downstream equipment (EPA AgSTAR, "Anaerobic System Design and Technology"). The composition envelope annotated on the PFD is wide because it shifts with substrate — a typical breakdown is 50–75% methane, 25–45% carbon dioxide, 2–7% water, with the balance made up of small fractions of oxygen, nitrogen, ammonia, hydrogen sulfide and trace gases (Williams, 2015, as cited in PG&E's "Anaerobic Digestion Technical Analysis"). Biogas thermal value sits at approximately 22 MJ/m³ against pure methane at 36 MJ/m³ (PG&E). End-use nodes on the gas train include a combined-heat-and-power or engine-generator set, direct boiler firing, upgrading to RNG/CNG, and a continuously operating or emergency flare (EPA AgSTAR; PG&E). About 85% of AD projects use the gas for electricity or cogeneration at 20–30% electrical efficiency (Banks, 2018, as cited in PG&E), and waste heat from the engine is normally piped back to the digester heater loop. Downstream of any upgrading step, pipeline injection, CNG vehicle fuel and advanced biochemicals are the documented options (EPA AgSTAR, "How Does Anaerobic Digestion Work?").
| Parameter | Typical range or value | Source |
|---|---|---|
| Methane (CH₄) | 50–75% | Williams, 2015, via PG&E |
| Carbon dioxide (CO₂) | 25–45% | Williams, 2015, via PG&E |
| Water vapor (H₂O) | 2–7% | Williams, 2015, via PG&E |
| Oxygen (O₂) | <2% | Williams, 2015, via PG&E |
| Nitrogen (N₂) | <2% | Williams, 2015, via PG&E |
| Ammonia (NH₃) | <1% | Williams, 2015, via PG&E |
| Hydrogen sulfide (H₂S) | <1% | Williams, 2015, via PG&E |
| Trace gases | <2% | Williams, 2015, via PG&E |
| Biogas thermal value | ~22 MJ/m³ | PG&E, "Anaerobic Digestion Technical Analysis" |
| Methane thermal value | ~36 MJ/m³ | PG&E, "Anaerobic Digestion Technical Analysis" |
| Share of AD projects using gas for electricity/cogeneration | ~85% | Banks, 2018, via PG&E |
| Electrical efficiency, CHP/engine-generator | 20–30% | Banks, 2018, via PG&E |
Block 4: Digestate Handling — Solids, Liquids and Reuse Paths
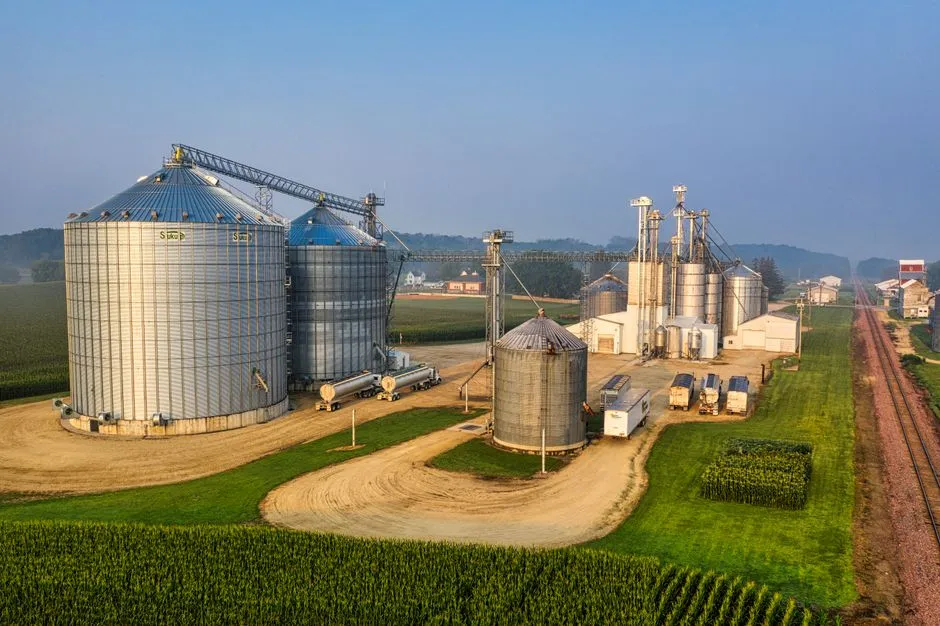
Digestate is a wet mixture that the flow diagram should split into a solid and a liquid fraction at a clearly drawn solids-separator node (EPA AgSTAR; PG&E, "Anaerobic Digestion Technical Analysis"). The solid fraction — called fiber in farm-based systems — is recovered with a solids separator and routed to animal bedding, soil amendment, compost, bio-based products such as bioplastics, and emerging structural applications including deck boards and particle board (EPA AgSTAR, "Anaerobic System Design and Technology"). The liquid effluent is a nutrient-rich fertilizer that displaces purchased commercial fertilizer and is normally returned to the plant's existing liquid handling train (EPA AgSTAR). For an industrial wastewater plant integrating an AD, the digestate handling block is where the diagram must hand off to a separate mechanical train — typically a plate and frame filter press for digestate dewatering — sized to the digester effluent solids load and to the cake-disposal path.
Digester Topologies Compared on the Flow Diagram
The same four functional blocks change shape depending on the digester topology, and the symbol set on the PFD must reflect these variations. A covered anaerobic lagoon is an ambient-temperature, low-solids design (less than 3% total solids, per RCM Digesters 2018 in PG&E) with a flexible cover and a single cell sometimes used for combined digestion and storage (EPA AgSTAR; PG&E). A plug flow digester is a long, narrow concrete enclosure — primarily for dairy scraping systems — that pushes manure from inlet to outlet under a rigid or flexible cover (EPA AgSTAR, "Anaerobic System Design and Technology"). A complete mix digester is an enclosed, heated tank with mechanical, hydraulic or gas mixing that tolerates a broader range of solids and benefits from some dilution with water (EPA AgSTAR; PG&E). A UASB reactor is described as a "three-phase separator" because it handles gas, water and sludge under high turbulence, allowing a cheaper and more compact design (PG&E, "Anaerobic Digestion Technical Analysis"); for a focused walkthrough, see the UASB reactor process flow diagram guide. A fixed film digester is a column packed with media such as wood chips, with biomass attached to the media and liquid flowing through (PG&E).
| Topology | Mixing / HRT signature | Solids handling | Notes for the PFD |
|---|---|---|---|
| Covered lagoon | Ambient, no active mixing; flexible cover | <3% total solids, diluted manure (RCM 2018 via PG&E) | Single cell may combine digestion and storage (EPA AgSTAR) |
| Plug flow | Unmixed, push-through; long narrow tank | Higher solids; scraping systems | Rigid or flexible cover; primarily dairy (EPA AgSTAR) |
| Complete mix | Mechanical, hydraulic or gas mixing; heated | Broader solids range; benefits from dilution with water | Enclosed steel/concrete tank (EPA AgSTAR; PG&E) |
| UASB | Up-flow sludge blanket; three-phase separator | High-rate, compact | Gas/water/sludge disengagement is a control point (PG&E) |
| Fixed film | Biomass attached to media; liquid flows through | Solids stay on media | Columns packed with media such as wood chips (PG&E) |
Engineering Deliverables: From Block Diagram to P&ID
The PFD serves as the starting point for a comprehensive engineering package, not the final deliverable. Downstream of an approved block diagram, the engineer must produce a mass and energy balance, equipment datasheets and sizing calculations, a control philosophy, the full P&ID, a HAZOP, and a commissioning plan. Every PFD should already call out the control points the P&ID will instrument: feed flow, digester temperature, pH, gas flow and composition, digester level, and pressure safety valves on the gas train. For a UASB, the three-phase separator is itself a control point — gas-liquid-solids disengagement must be engineered to avoid sludge washout (PG&E, "Anaerobic Digestion Technical Analysis"). For projects seeking financing or regulatory approval, expect to be asked for feedstock characterization, expected gas yield, and flare usage assumptions; the EPA AgSTAR documentation frames these as the standard data package lenders and permitting reviewers look for. Treat the PFD as a contract for the rest of the document set, as any omitted details will be scrutinized during the HAZOP process.
Frequently Asked Questions
What is the difference between an AD PFD and a P&ID, and which one do I produce first?
A PFD shows unit operations, streams and major operating conditions; a P&ID adds every instrument, control valve, safety interlock and pipe specification. The PFD is produced first, then expanded into the P&ID once the control philosophy is set. EPA AgSTAR's "Anaerobic System Design and Technology" page models the block-diagram level; the P&ID is the engineering deliverable built on top of it.
Which PFD nodes change between covered lagoon, plug flow, complete mix, UASB and fixed film topologies?
The reactor block changes most significantly between these designs. Covered lagoons use an ambient, unmixed basin with a flexible cover; plug flow uses a long, narrow push-through tank; complete mix uses a heated, mechanically mixed tank; UASB uses an up-flow three-phase separator; fixed film uses a packed media column (EPA AgSTAR, "Anaerobic System Design and Technology"; PG&E, "Anaerobic Digestion Technical Analysis"). Pretreatment, gas train and digestate handling blocks remain consistent across these topologies.
What does a typical methane yield look like on the diagram, and why does co-digestion lift it?
PG&E's "Anaerobic Digestion Technical Analysis" cites a working benchmark of approximately 0.35 m³ of CH₄ per kilogram of waste converted, depending on