

What MBR Capacity and Sizing Actually Means
MBR capacity and sizing is a two-output engineering problem. The first output is the membrane area in square metres, driven almost entirely by design flow and net permeate flux. The second output is the bioreactor working volume in cubic metres, driven by the applied BOD load, the chosen SRT, and the target MLSS. Both outputs are coupled because the membrane module sits inside the aeration tank, so the tank that satisfies the biology also has to physically accommodate the rack area you just calculated.
Four inputs control everything downstream: design flow in KLD or m³/d, net permeate flux in litres per m² per hour (LMH), the target MLSS and SRT pair, and a fouling/peak-load safety margin. The membrane area formula, as published in standard submerged flat-sheet MBR design references, is Membrane area = Daily flow (L/hr) / Net flux (LMH), where daily flow in L/hr = Flow (KLD) × 1000 / operating hours per day (Spans Envirotech MBR sizing calculator, Spans Envirotech). The bioreactor volume side is preliminary until you have representative wastewater characterisation, a confirmed membrane supplier selection, and a site-specific process verification, because the yield coefficient, MLVSS/MLSS ratio, and peak-load envelope only hold for a given feed (MBR Network sizing calculator, MBR Network).
Step 1: Convert Design Flow into Hydraulic Load on the Membranes
Design flow must be converted into an hourly load to determine the required membrane rack capacity. Design flow is not the same as average flow, and it is not the same as peak flow; pick one and write it down, because the membrane area calculation is linear in this number and an unstated peak factor will quietly double your CAPEX or starve the membranes during a shift.
The conversion itself is mechanical: hourly membrane feed (L/hr) = KLD × 1000 ÷ operating hours per day (Spans Envirotech MBR sizing calculator, Spans Envirotech). The operating-hours choice is the lever most introductory pages skip. A 100 KLD plant run for 24 hours needs a very different membrane area from the same plant run for 20 hours, because the hourly load roughly doubles when you drop four hours for a daily maintenance/cleaning window. Industrial MBRs are typically designed against a 20 hrs/day operating window to leave headroom for relaxation, backflush, and chemical cleaning-in-place cycles, and reducing the operating window raises required membrane area proportionally (Spans Envirotech MBR sizing calculator, Spans Envirotech).
This hourly load is the denominator in the area equation, so any error made here — wrong peak factor, wrong hours/day, wrong unit conversion — propagates straight into the module count and the bioreactor footprint. Treat it as a locked input once it is documented.
Step 2: Pick Net Permeate Flux by Wastewater Character

Net permeate flux in LMH is the single most important MBR design parameter, as it directly trades capital cost against fouling rate and cleaning frequency (Spans Envirotech MBR sizing calculator, Spans Envirotech). Halving the flux doubles the membrane area and roughly doubles the membrane CAPEX, so the chosen number has to be defensible at design review, not picked from a generic textbook table.
The published flux bands for submerged flat-sheet MBR are: 15–18 LMH for clean municipal or food processing wastewater with inlet TSS below 300 mg/L, and 10–13 LMH for higher-TSS industrial feeds such as dairy, slaughterhouse, or textile (Spans Envirotech MBR sizing calculator, Spans Envirotech). Selecting a flux at the high end of the band reduces required membrane area and lowers CAPEX, but it increases fouling rate, chemical cleaning frequency, and membrane replacement cost over the asset life. Selecting a flux at the low end is conservative and expensive on day one but buys operating margin.
Whatever you pick, document the flux assumption together with the inlet TSS basis and a one-line fouling tendency note. That single line is what stands between a defensible design and a procurement challenge six months after commissioning.
Step 3: Solve Bioreactor Volume from a Solids Balance
Bioreactor volume is a solids balance problem rather than a simple HRT calculation. The tank has to hold enough active biomass at the chosen SRT and MLSS to treat the applied BOD load, and "enough" depends on how much new biomass the feed generates per day versus how much you waste per day at the design SRT.
The standard preliminary-design defaults for this balance are a sludge yield coefficient Y of 0.40 kg biomass per kg BOD applied, and an MLVSS/MLSS fraction of 0.80 used to convert volatile solids into total suspended solids for the tank concentration (MBR Network sizing calculator, MBR Network). The three inputs the engineer must collect or assume before this balance closes are: applied BOD load in kg/d (from flow and influent BOD), target SRT in days (typically 15–30 days for municipal-style MBR, longer for industrial toxic loads), and target MLSS in mg/L (commonly 8,000–12,000 mg/L for submerged MBR).
With those three inputs, the calculator uses the selected SRT and MLSS to derive a solids-balanced bioreactor volume and the resulting hydraulic retention time, but it returns a preliminary result only; detailed design requires representative wastewater data, a confirmed membrane supplier, and site-specific process verification (MBR Network sizing calculator, MBR Network). The HRT that falls out of this volume is a check, not a primary input — if HRT is below about 4 hours on a municipal feed, the biology is almost certainly undersized regardless of the membrane calculation.
MBR Design Parameter Reference Table

Every numeric design value introduced above is consolidated here. Paste this table into your calculation sheet and sanity-check each input against its source line before you commit a number to a client report.
| Parameter | Value / Range | Design Implication |
|---|---|---|
| Net flux — clean municipal / food, TSS <300 mg/L | 15–18 LMH | High end saves area, raises fouling rate and cleaning frequency (Spans Envirotech MBR sizing calculator, Spans Envirotech) |
| Net flux — dairy / slaughterhouse / textile | 10–13 LMH | Lower flux needed for higher-TSS industrial feeds (Spans Envirotech MBR sizing calculator, Spans Envirotech) |
| Safety margin on membrane area | 15–20% | Industrial designs should always include margin for peak loads and fouling events (Spans Envirotech MBR sizing calculator, Spans Envirotech) |
| Sludge yield coefficient Y | 0.40 kg biomass per kg BOD applied | Default used in solids balance for preliminary volume (MBR Network sizing calculator, MBR Network) |
| MLVSS / MLSS fraction | 0.80 | Converts volatile inventory to total suspended solids in tank (MBR Network sizing calculator, MBR Network) |
| Normal submerged MBR TMP | 0.1–0.3 bar | Design operating window during filtration (Spans Envirotech MBR sizing calculator, Spans Envirotech) |
| Chemical cleaning trigger | TMP > 0.5 bar at design flux | Triggers CIP; consistent high TMP at low flux indicates irreversible fouling (Spans Envirotech MBR sizing calculator, Spans Envirotech) |
| MBR permeate for RO / ZLD feed | BOD <5 mg/L, TSS <2 mg/L, turbidity <1 NTU | Permeate quality that makes downstream RO viable (Spans Envirotech MBR sizing calculator, Spans Envirotech) |
| Membrane replacement interval | Every 7–10 years | Main OPEX line item in lifecycle cost (Spans Envirotech MBR sizing calculator, Spans Envirotech) |
Step 4: Apply the Safety Margin and Translate Area into Modules
Translating the calculated area into physical modules requires accounting for the safety margin to ensure operational reliability. Using the standard 100 KLD, 20 hrs/day, 15 LMH example: bare membrane area = 100,000 / 20 / 15 = 333 m², which rounds up to 14 modules at 25 m²/module (Spans Envirotech MBR sizing calculator, Spans Envirotech). That is the textbook planning number. It assumes steady flow, no fouling excursions, and a perfectly behaved feed — none of which hold for a real industrial plant.
Apply the 15–20% safety margin to convert that planning number into an industrial design point: 333 m² × 1.15 to 333 m² × 1.20, giving a designed area of roughly 383–400 m² and a correspondingly higher module count (Spans Envirotech MBR sizing calculator, Spans Envirotech). The safety margin is what turns a calculator output into something an operator can live with during peak shifts, recovery cleans, and the inevitable fouling event in month eleven.
In practice, module count is rounded to fit a vendor's standard panel size rather than left as a raw m² figure. HydropureWater integrated MBR system configurations are typically built around DF series flat-sheet MBR modules that are individually replaceable and ship in 80–225 m² panel configurations producing 32–135 m³/day per skid, so the module count from the area calculation should be rounded up to the nearest standard skid envelope before it goes to procurement.
Sizing Checkpoints: TMP, Permeate Quality, and ZLD/RO-Feed Duty
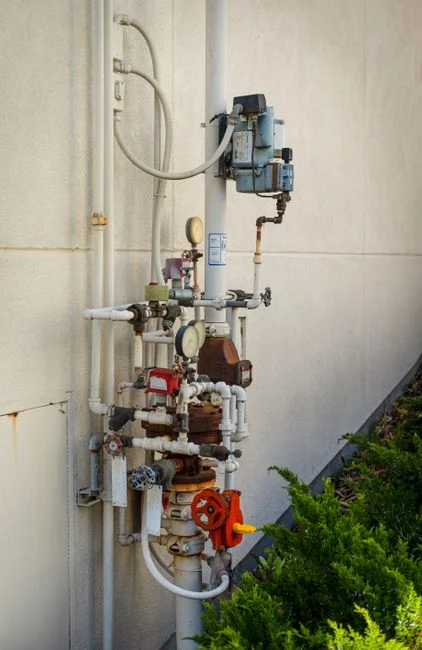
Transmembrane pressure (TMP) represents the pressure difference across the membrane during filtration and defines the operating envelope for the system's life. Normal operation for submerged MBR is 0.1–0.3 bar; rising TMP indicates fouling, and when TMP exceeds 0.5 bar at design flux, chemical cleaning is triggered (Spans Envirotech MBR sizing calculator, Spans Envirotech). Treat TMP as a sizing-side constraint, not just an operating metric: a design that runs too close to 0.5 bar on day one has no fouling headroom and will trip early cleanings, eating into the membrane replacement interval.
For ZLD/RO-feed duty, the permeate must hit BOD below 5 mg/L, TSS below 2 mg/L, and turbidity below 1 NTU, which is the MBR performance band that makes RO downstream viable (Spans Envirotech MBR sizing calculator, Spans Envirotech). MBR permeate in this band reduces RO membrane fouling, extends RO cleaning intervals, and improves RO recovery compared to conventional biological + clarifier + filter combinations.
One boundary the sizing calculation must respect: MBR does not reduce TDS, because TDS passes through UF/MF membranes. For feeds with TDS above 2,000 mg/L targeting TDS reduction, RO is required downstream of MBR, and MBR + RO + MEE/MVR is the standard ZLD configuration for high-TDS industrial wastewater (Spans Envirotech MBR sizing calculator, Spans Envirotech). The downstream industrial RO system selection should be checked against the MBR permeate targets before either unit is sized, so the two stages do not fight each other on flux or recovery.
Frequently Asked Questions
Should I pick flat-sheet or hollow-fibre MBR modules for my flow?
Flat-sheet modules are the default for industrial ZLD/RO-feed duty because they handle high MLSS, are individually replaceable, and tolerate the chemical cleaning cycles used on tough industrial feeds. Hollow-fibre modules pack more area per cubic metre and can win on footprint for large municipal flows. For a side-by-side specification, flux, and cost comparison, work through the industrial hollow-fibre MBR selection guide before locking the module type.
What does a 50–500 KLD MBR plant cost in India, and how does it compare to MBBR?
Published MBR plant cost in India is ₹55–120 lakhs for 50 KLD, ₹1.5–3 Crore for 100–200 KLD, and ₹3–8 Crore for plants up to 500 KLD, with MBR priced 40–60% above conventional MBBR for the same flow because of the membrane rack and higher instrumentation (Spans Envirotech M
Frequently Asked Questions
What flux should I use to size an MBR for industrial wastewater?
For industrial wastewater applications, design flux rates typically range from 10 to 25 LMH (liters per square meter per hour), depending heavily on the specific pollutant load and biodegradability. High-strength industrial streams often require conservative design flux values between 12 and 18 LMH to prevent rapid membrane fouling and to maintain sustainable operation between chemical cleanings.
How is MBR membrane area calculated from flow in KLD?
The required membrane surface area is calculated using the formula A = Q / (J × 24), where A is the total membrane area in square meters, Q is the design flow in liters per day (KLD × 1000), and J is the design operating flux in LMH. Engineers must incorporate a safety factor of 15% to 20% to account for membrane maintenance, backpulsing cycles, and potential flux decline over time.
How much does an MBR plant cost in 2026 for 50 to 500 KLD?
As of 2026, capital expenditure for skid-mounted MBR systems in the 50 to 500 KLD range typically varies between $400 and $800 USD per cubic meter of daily capacity. This pricing reflects integrated automation, high-quality PVDF or PES hollow-fiber membranes, and stainless steel housing, though costs fluctuate based on the required pretreatment stages and the complexity of the influent contaminant profile.
Does an MBR need an RO system downstream to meet discharge norms?
An MBR system alone is generally sufficient to meet stringent BOD, TSS, and turbidity discharge standards, often producing permeate with <5 mg/L BOD and <1 NTU turbidity. However, an RO system is only required if the objective is water reuse for high-pressure boilers or if specific local regulations mandate the removal of dissolved solids, heavy metals, or specific micropollutants that biological treatment cannot address.
What TMP level should trigger chemical cleaning in a submerged MBR?
Transmembrane Pressure (TMP) should be monitored continuously; as a general rule, a Maintenance Clean (MC) should be initiated when the TMP rises by 0.2 to 0.3 bar above the baseline operating pressure. If the TMP reaches a sustained level of 0.5 to 0.7 bar, or if the permeate flux cannot be maintained despite backpulsing, a full Recovery Clean (RC) using sodium hypochlorite and citric acid is necessary to restore membrane permeability.