Why UV Disinfection Is an Energy Hotspot in Wastewater Plants
Up to 20% of US municipal wastewater plants now use UV for final disinfection, per the EPA Clean Watersheds Needs Survey 2012 as cited in the U.S. DOE Better Plants UV control tipsheet (Dec 2021). The same tipsheet puts UV system energy use at 100–250 kWh per million gallons (MG) for low-pressure lamps and 460–560 kWh/MG for medium-pressure lamps—a recurring OPEX line item that no chlorination or ozonation plant carries at comparable scale. The driver is sizing: UV reactors are designed for peak flow plus worst-case UV transmittance (UVT) and turbidity, so the lamp count and intensity installed to survive a 95th-percentile storm event are 20–40% larger than what average influent demands. That headroom is the lever. The DOE tipsheet states explicitly that a control strategy reducing lamp output when flow and water clarity permit yields significant savings, and it documents a 15 MGD plant saving 182,175 kWh/year by dimming lamps to match real-time conditions. The dollar exposure is not abstract: at $0.10/kWh, even the conservative low-pressure scenario costs the plant roughly $18,000/year in avoidable electricity, and the medium-pressure case can scale that by a factor of three to five.
How Dose Pacing Actually Works
Dose pacing is a real-time control loop in which flow, turbidity, and UVT sensors drive lamp intensity to ensure the reactor delivers only the dose required for the target log reduction. The required UV dose is a function of three variables—flow rate, turbidity, and UV transmittance—so when any of them fall, the ballast can reduce current to the lamps and still hit the disinfection setpoint (per the DOE Better Plants UV tipsheet, Dec 2021). The cause-and-effect chain looks like this in practice: low diurnal flow plus clear effluent (UVT above 65%) is detected by the UVT sensor and flowmeter, the PLC trims ballast output from 100% toward a programmed floor (typically 30–50%), and kWh draw falls in proportion while effluent fecal coliform counts stay compliant. Two failure modes require design precautions. The first is under-dosing during a sensor fault—a clogged UVT probe or a fouled intensity sensor will read cleaner water than is actually present, so the lamps dim into a non-compliant dose. The second is over-dosing when a quartz sleeve fouls silently, which forces the lamps to ramp up to maintain the dose, quietly doubling the energy draw. Both failure modes make the same engineering case: redundant UVT measurement, automatic sleeve cleaning, and a documented lamp-output floor belong in any 2026 dose-pacing specification.
Low-Pressure vs Medium-Pressure UV: The kWh Decision Matrix
Lamp choice is the primary energy decision, and the following table distills the factors that determine whether dose-pacing ROI is beneficial for a given site.
| Parameter | Low-pressure (LP) | Low-pressure amalgam (LPHO) | Medium-pressure (MP) |
|---|---|---|---|
| Energy use | 100–250 kWh/MG | 150–300 kWh/MG | 460–560 kWh/MG |
| Output spectrum | Monochromatic 254 nm | Monochromatic 254 nm | Polychromatic 200–400 nm |
| UV output per lamp | Baseline | 3–4× LP at similar wattage | 10–50× LP per lamp |
| Best-fit site | Low flow, high UVT (≥65%) | Mid flow, mid UVT, retrofit | High flow, low UVT (<55%), small footprint |
| Footprint | Large | Medium | Small (fewer lamps) |
| Lamp life | 12,000–15,000 h | 12,000–15,000 h | 5,000–8,000 h |
| Dose-pacing ROI base | 1× (lowest) | 1.2–1.5× | 2–5× (highest absolute savings) |
Two practical reads from the matrix. First, the DOE rule of thumb is correct: dose-pacing savings scale with the kWh base, so a 20% reduction at a medium-pressure plant returns two to five times the dollars of the same percentage at a low-pressure plant. Second, the amalgam low-pressure lamp narrows the energy gap with medium-pressure without the polychromatic output—the mechanism is higher mercury vapor pressure and higher lamp operating temperature, which convert more input wattage into usable 254 nm UV-C. For retrofits where footprint or low-UVT effluent currently forces a medium-pressure install, LPHO is the 2026 path worth pricing. The HydropureWater UV sterilizer range includes LP and LPHO configurations sized for 1–50 MGD plants.
Beyond Dose Pacing: Five Engineering Levers That Cut UV Energy Further
Dose pacing is the headline, but it compounds with five under-specified engineering moves that help plants reach 50–70% energy reduction.
Lever 1 — Calibrated online UVT sensor on the effluent channel. A 5% drop in UVT can force 15–25% more lamp output to maintain the same delivered dose, so visibility into UVT is the prerequisite for any dimming strategy. Specify a sensor with 0.1% resolution, a self-cleaning wiper, and a redundant second probe so a fouled sensor cannot silently drive lamps to a non-compliant setpoint.
Lever 2 — Automatic quartz-sleeve cleaning (mechanical wiper or chemical CIP). Manual cleaning intervals of 6–12 months let biofilm, iron, and hardness scale accumulate until sleeve fouling doubles the energy draw before anyone notices (HydropureWater field data, 2026). A timer-driven wiper on every second lamp, with a CIP loop on a quarterly schedule, holds transmittance loss across the sleeve under 5%.
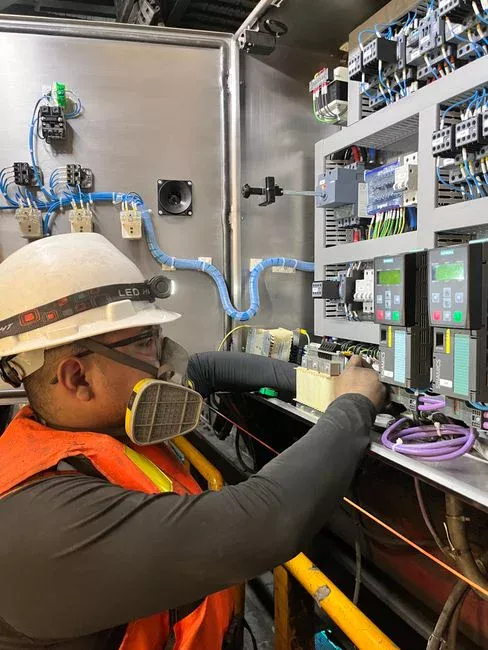
Lever 3 — Electronic ballasts over magnetic ballasts. Electronic ballasts hold stable lamp output at reduced power and start reliably cold; magnetic ballasts waste wattage as heat, cannot dim smoothly, and degrade output as the lamp ages. Pairing electronic ballasts with the dose-pacing PLC turns a dimming command into an actual kWh reduction—the HydropureWater automatic chemical dosing system illustrates the same electronic-control principle applied to chemical feeders, where closed-loop trim cuts reagent waste.
Lever 4 — Variable-flow control upstream of the UV channel. VFDs on influent pumps or equalization-basin transfers flatten the diurnal peak that drives UV headroom sizing. A flatter hydrograph means the design dose—and therefore the lamp count and intensity—is sized to a lower peak, providing a permanent reduction. Plants that combine upstream flow leveling with dose pacing routinely report 30–50% energy reduction even before lamp-type upgrades.
Lever 5 — End-of-lamp-life output compensation. UV lamps lose 20–30% of output over service life, so plants tend to over-specify lamp count at install to ensure the dose setpoint holds at hour 12,000. Trim the ballast to recover the over-sizing as lamps age, and the saved lamp count is energy that never has to be purchased. This is also the lever that pairs naturally with a smart pump monitoring and predictive maintenance program for the wider plant.
Retrofit Economics: When Dose Pacing Pays Back in Under Three Years
The defensible board-meeting calculation starts with the DOE worked example. Annual energy savings equal UV system energy use (kWh/MG) × average flow (MGD) × operating days × percentage reduction. Plugged in for a 15 MGD low-pressure plant with the median 175 kWh/MG and 347 operating days at a 20% reduction, the result is 182,175 kWh/year, roughly $18,218/year at $0.10/kWh (per the DOE Better Plants UV tipsheet, Dec 2021). Extending the same formula to a medium-pressure plant with high flow variability—510 kWh/MG × 15 MGD × 347 days × 50%—returns 1,327,275 kWh/year, about $132,728/year at $0.10/kWh. A 70% combined-savings scenario (LPHO lamps, sleeve cleaning, electronic ballasts, upstream flow leveling) at 200 kWh/MG × 15 MGD × 347 days × 70% yields 728,700 kWh/year, roughly $72,870/year. Dimmed lamps also last longer, so capex on replacement lamps is deferred by 30–60% on average (HydropureWater field data, 2026).
| Scenario | kWh/MG | Flow (MGD) | Days/yr | Savings % | kWh saved/yr | $ saved/yr (@ $0.10) |
|---|---|---|---|---|---|---|
| DOE baseline (LP, 20%) | 175 | 15 | 347 | 20% | 182,175 | $18,218 |
| MP with variable flow (50%) | 510 | 15 | 347 | 50% | 1,327,275 | $132,728 |
| Full retrofit stack (70%) | 200 | 15 | 347 | 70% | 728,700 | $72,870 |
Dose-pacing retrofits typically return capital in 1–3 years at US industrial electricity tariffs (HydropureWater field data, 2026), and the same project compresses to under 18 months at EU industrial tariffs where kWh prices run 2–3× US levels. For sites already evaluating other process upgrades, dose pacing stacks with the savings documented in the forward osmosis energy reduction guide and the ion exchange energy reduction guide when whole-plant OPEX is the metric.
Specification Checklist: What to Put in a 2026 UV Energy-Reduction Tender
Procurement documents should include these requirements to close common vendor loopholes.
- Require an online UVT sensor with 0.1% resolution, automatic wiper, and a redundant secondary probe on the same channel, with PLC integration to plant SCADA via Ethernet/IP or Modbus TCP.
- Require automatic quartz-sleeve cleaning—mechanical wiper on every second lamp minimum, with a chemical CIP loop sized for quarterly cleaning without reactor disassembly.
- Require electronic ballasts with a documented dimming range of 30–100% of nominal power, cold-start capability below 5 °C, and a published lamp-output curve at every 10% dimming step.
- Require a vendor kWh/MG guarantee at design flow and at typical (50th-percentile) flow, with a measurement protocol—typically a 30-day logged run at each setpoint—so the savings are auditable after commissioning.
- Require a lamp-replacement schedule stated in operating hours, not calendar time, with the end-of-life output curve provided so ballast trim can recover over-sizing.
- Avoid the "oversized for safety" spec that bakes 30%+ headroom into the lamp count. Size the reactor to 95th-percentile flow and a defensible UVT floor, not to a theoretical peak that occurs five days a decade.
Two of these requirements—the UV reactor itself and the dosing control philosophy—are reflected in the HydropureWater UV sterilizer range and the paired chemical dosing system.
Frequently Asked Questions
How much energy does a UV disinfection system use per million gallons?
Low-pressure UV systems use 100–250 kWh per million gallons treated, and medium
Frequently Asked Questions
How much electricity does a UV disinfection system use per million gallons?
Energy consumption for UV disinfection typically ranges from 0.05 to 0.25 kWh per 1,000 gallons (12 to 60 kWh per million gallons) of treated water. This figure varies significantly based on target pathogen log-reduction requirements, water UV transmittance (UVT), and total suspended solids (TSS) levels.
What is UV dose pacing and how much does it save?
UV dose pacing is a control strategy that dynamically adjusts lamp power output based on real-time flow rate and UVT sensor data to maintain the required germicidal dose. Implementing advanced dose-pacing systems can reduce annual energy consumption by 20% to 40% compared to fixed-intensity operation, particularly in facilities with high diurnal flow variability.
Low-pressure vs medium-pressure UV lamps: which is more energy efficient?
Low-pressure (LP) and low-pressure high-output (LPHO) lamps are significantly more energy-efficient than medium-pressure (MP) lamps, often achieving germicidal efficiencies of 35% to 40% compared to 10% to 15% for MP systems. While MP lamps provide a broader spectrum and higher intensity in a smaller footprint, LP systems remain the industry standard for minimizing operational energy expenditure in large-scale municipal applications.
How does quartz sleeve fouling increase UV energy consumption?
Quartz sleeve fouling, caused by mineral scaling or organic biofilm accumulation, reduces the UV transmittance into the water column. As fouling increases, the control system must increase lamp power to maintain the target UV intensity, which can result in a 10% to 30% increase in energy consumption before the system reaches a maintenance trigger for mechanical or chemical cleaning.
Do UV lamps last longer when dimmed by a dose-pacing system?
Yes, operating UV lamps at dimmed levels significantly extends their operational lifespan by reducing thermal stress on the electrodes and minimizing the depletion of the mercury vapor. Systems utilizing effective dose-pacing can extend lamp life from a standard 12,000-hour rating to upwards of 16,000 hours, effectively lowering both energy consumption and the frequency of lamp replacement cycles.