
What MBR Membrane Cleaning Actually Solves
Membrane fouling in a submerged MBR is the combined deposition of biomass, extracellular polymeric substances (EPS), and inorganic precipitates on the surface of a 0.1 µm PVDF flat-sheet membrane or inside its pores — the same fouling-control challenge that backwashing and chemical cleaning were originally designed to manage (Wikipedia, 2026). The Jijingi et al. (2024) review of MBR for industrial wastewater explicitly names fouling as the dominant operational problem, and lists backwashing plus chemical cleaning as the two countermeasures that extend membrane life (Jijingi et al., Case Studies in Chemical and Environmental Engineering, Vol. 10, 2024-12).
Three layers build up over time, and they respond differently to intervention:
- Gel/cake layer — loose biomass and soluble EPS sitting on the surface; reversible by hydraulic shear from coarse-bubble air scour or a backwash pulse.
- Pore blocking — small flocs and colloidal EPS lodged inside the 0.1 µm pores; partial recovery by backwash, full recovery usually requires chemical CIP.
- Irreversible fouling — chemically or biologically altered foulant (bound EPS, mineral scale fused to the polymer); only chemical CIP recovers it, and only partially.
The 2026 BF-OMBR study (Wang et al., Materials 19(16):3395, 2026-10) demonstrates that next-generation designs are starting to engineer the biofilm to limit fouling rather than fight it with chemicals — useful context for why most operating plants still rely on a robust cleaning protocol instead of waiting for new membrane biology to arrive.
The Operating Window That Keeps Membranes Cleanable
Most of the chemical cleaning cost in an MBR is downstream of avoidable operational mistakes. The 2026 Wikipedia summary of MBR design practice gives the operating envelope that any PVDF flat-sheet plant should be living inside before the operator opens a CIP valve (Wikipedia, 2026):
| Parameter | Typical Submerged MBR Range | Notes for Operators |
|---|---|---|
| MLSS | 10,000–15,000 mg/L (sweet spot ≈10,000) | Above 15,000 mg/L, oxygen transfer collapses and the cake layer compacts faster than air scour can strip it. |
| SRT | 10–20 days | Lower than 10 days starves nitrifiers; higher than 20 days pumps EPS-bound fouling potential. |
| HRT | 3–10 h | Hydraulic residence time controls F/M ratio and shock loading. |
| TMP ceiling | 0.3–0.5 bar | Trigger threshold for a recovery CIP; do not run above 0.6 bar for sustained periods on PVDF flat-sheet modules. |
| Immersed MBR MLSS tolerance | 4–12 g/L (iMBR) vs. 2.5–3.5 g/L (conventional) | A 300% suspended-solids tolerance advantage over a settling-tank plant — the reason immersed MBRs can run tight SRTs without losing biomass. |
| Submerged flux vs. first-generation side-stream | ≤25% of first-gen flux | Modest flux is intentional: pushing it accelerates irreversible fouling, which no CIP fully reverses. |
If a plant is sitting outside the 10–15 g/L MLSS band or running SRT above 20 days, the cleaning frequency will climb regardless of how aggressive the chemistry gets. The first move is almost always to fix the upstream biology, not to escalate the CIP dose. Plants standardizing on a packaged HydropureWater integrated MBR system typically have the aeration piping and MLSS instrumentation already sized to hold this envelope without operator improvisation.
Diagnosing the Fouling Type Before You Dose Anything
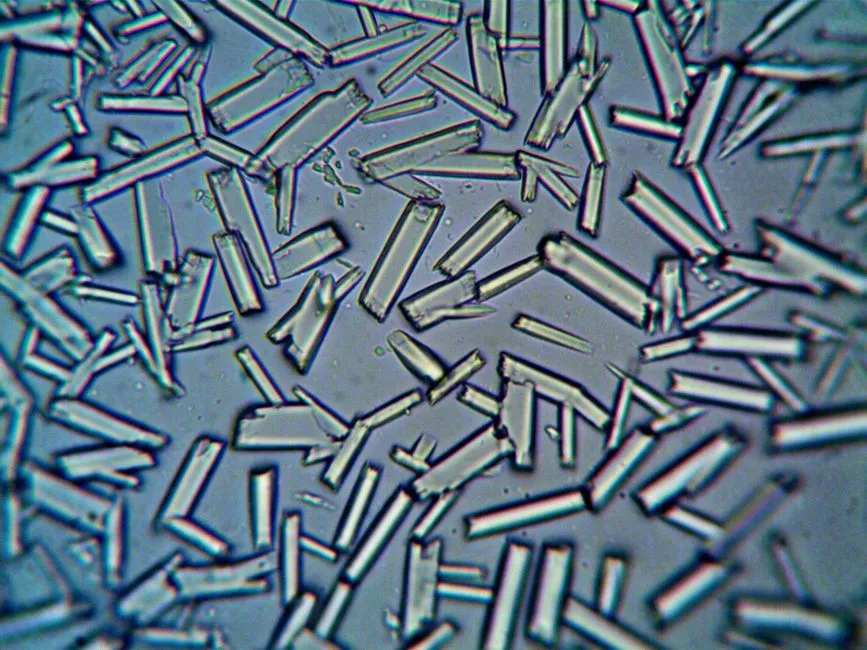
Wrong chemistry wastes time and damages PVDF. Before opening a chemical jug, read three signals: the SCADA trend, the membrane element itself, and the influent log. A slow, steady TMP climb of roughly 0.2–0.4 bar per week points to biofouling and bound EPS consolidation; a sudden step change of 0.1 bar or more in a single shift points to scaling or a hydraulic slug. Pull one flat-sheet element from the cassette and look at the cake: brown and slimy is biological, white and crusty is CaCO₃ or silica, gray and gelatinous is EPS with bound water. Cross-check against the influent log — rising hardness, a pH excursion above 8, or a fats-oils-grease spike from a food-and-beverage tributary will usually explain the symptom on the membrane.
Trending aeration pressure at the blower discharge is an early-warning channel that operators routinely underuse. A rising aeration-side pressure at constant blower output is the signature of cake compaction and typically shows up 5–7 days before TMP reflects the change. Plotting dTMP/dt weekly — the slope of the TMP line, not the absolute value — turns a reactive job into a scheduled one. Jijingi et al. (2024) frame the same point from the design side: selecting the right membrane and confirming the influent characteristics is a prerequisite to any chemical strategy, not a separate decision (Jijingi et al., 2024-12).
One compatibility caveat that drives the rest of this article: ceramic membranes tolerate pH 1–14 swings, but standard PVDF flat-sheet modules do not. The cleaning envelope below applies specifically to PVDF modules with a 0.1 µm pore size, including the DF-series PVDF flat-sheet MBR module. Stay inside the pH and temperature bands in the recipe matrix and the module will survive hundreds of CIPs; step outside them and you will start baking the polymer.
Step-by-Step Cleaning Protocol: From Backwash to Recovery CIP
The protocol runs in three tiers, each triggered by a measurable signal. Tiers 1 and 2 are designed to keep the membrane in a reversible state; Tier 3 is what you run when the reversible budget has been spent.
- Tier 1 — Online backwash and air scour. Every 10–30 minutes of the filtration cycle, run a permeate-side backwash at 30–50 kPa for 30–60 seconds. Coarse-bubble aeration beneath the modules runs continuously and provides the shear that strips the cake — Wikipedia (2026) lists this dual function (oxygen supply plus membrane cleaning) as one of the dominant parameters in submerged MBR performance.
- Tier 2 — Maintenance CIP (every 1–4 weeks, online or short offline). Dose 500–1,000 mg/L NaOCl through the backwash line, target pH 10–11, soak 30–90 minutes at 25–30 °C. This is an oxidizing soak aimed at biological fouling and soluble EPS before they consolidate into bound EPS.
- Tier 3 — Recovery CIP (offline, triggered by TMP). Run when TMP crosses 0.4–0.5 bar or when Tier 2 no longer restores permeability. The sequence is not optional:
- 1–2% citric acid, pH 2–3, 2–4 hours at 30–35 °C, to dissolve inorganic scale.
- Rinse with permeate to neutral pH.
- 1,000–2,000 mg/L NaOCl, pH 10–11, 2–6 hours at 30–35 °C, to oxidize organic and biological fouling.
- Final rinse with permeate until pH and free chlorine return to feed values.
For severe scaling in high-hardness or high-sulfate feedwater (often >800 mg/L as CaCO₃ combined with >250 mg/L sulfate), add an intermediate 0.5–1% oxalic acid step at pH 1–2 for 1–2 hours at 25–30 °C, then rinse to neutral before the hypochlorite stage. Never mix acid and hypochlorite in the same CIP step — the off-gas is chlorine, and the regulatory conversation that follows is much worse than the membrane problem you started with.
After every recovery CIP, measure clean-water permeability at a fixed temperature (correct to 20 °C) and compare it to the commissioning baseline. This single number is the input to the replace-versus-clean decision in the final section of this article; without it, the rest of the procedure is guesswork.
CIP Recipe Matrix for Submerged PVDF MBRs
Pin this matrix next to the CIP skid. The columns are what an operator actually copies into a work order.
| Chemical | Concentration | Target pH | Soak Time | Temperature | Target Foulant | PVDF Compatibility Note |
|---|---|---|---|---|---|---|
| NaOCl (sodium hypochlorite) | 500–2,000 mg/L as Cl₂ | 10–11 | 0.5–6 h (maintenance 0.5–1.5 h, recovery 2–6 h) | 25–35 °C | Biological fouling, soluble EPS, bound EPS | Fully compatible inside the pH/temperature band; rinse thoroughly before acid stage. |
| Citric acid | 1–2 wt% | 2–3 | 2–4 h | 30–35 °C | CaCO₃, metal-oxide scaling | Compatible; preferred over strong mineral acids for routine scale. |
| Oxalic acid | 0.5–1 wt% | 1–2 | 1–2 h | 25–30 °C | Iron and sulfate scales | Limited use — rinse thoroughly and confirm with the membrane datasheet. |
| Sulfuric acid | 0.5% | ~1 | 1 h | 25 °C | Sulfate scales, strontium/calcium sulfate | Avoid on standard PVDF above pH 1 for prolonged soak; use only on acid-tolerant modules. |
| NaOH (caustic) | 0.5–1 wt% | ~12 | 1–2 h | 30 °C | Organic, humic, and proteinaceous fouling | Most PVDF modules tolerate pH 12 short-term; do not exceed pH 13 even briefly. |
Two operational notes that are not on the bottle. First, the figures above are typical industrial ranges synthesized from the SERP evidence base and supplier datasheets; confirm with the specific membrane manufacturer's chemical compatibility guide before each new chemical is introduced. Second, the safety interlock: never dose NaOCl into a CIP loop that still contains acid. Always rinse to neutral pH (6.5–7.5) and confirm with a pH probe before switching stages.
Preventive Habits That Cut CIP Frequency in Half
Chemical cleaning is reactive. The cheapest, fastest, and safest way to halve CIP frequency is to keep the upstream biology and hydraulics inside the design envelope. Four habits move the needle in practice.
- Verify aeration delivery. Confirm specific aeration demand per square meter of membrane area meets the OEM setpoint. Coarse-bubble diffusers below the modules foul and lose flow over time; a 15% drop in air flow can double the recovery CIP interval. Wikipedia (2026) treats aeration as one of the "major parameters in process performance" for exactly this reason.
- Manage SVI, not just MLSS. A sludge volume index above ~150 mL/g means bulking filamentous organisms are physically blocking the slots between flat-sheet elements, regardless of the MLSS reading. If SVI drifts, fix the biology before you reach for the chemicals.
- Protect the membrane tank with pretreatment. A rotary bar screen at 2 mm opening ahead of the MBR removes the rags, fibers, and plastics that initiate cake compaction. Route any chemical dosing — antifoam, coagulant, polymer — into a mixing zone that does not shortcut to the membrane tank. Jijingi et al. (2024) call this out as the prerequisite to any sustainable MBR operation (Jijingi et al., 2024-12). The GX-series rotary bar screen is a typical 2 mm opening unit sized for flows in the 10–2,000 m³/day range.
- Trend TMP, flux, and temperature daily; plot dTMP/dt weekly. A rising derivative is the earliest actionable signal that the next CIP is coming, and a maintained steady-state derivative is the proof that the cleaning regime is working. Without a dTMP/dt plot, operators are scheduling CIPs by the calendar rather than by the membrane.
When to Stop Cleaning and Replace the Module

At some point, the chemicals stop paying back. Three rules make the decision objective enough to defend to procurement and to a regulator.
| Observation After a Full Recovery CIP | Decision | Reasoning |
|---|---|---|
| Clean-water permeability recovers ≥90% of commissioning baseline | Keep the module; continue current regime. | Reversible fouling was the dominant share; chemistry is still effective. |
| Permeability recovers 80–90% | Continue cleaning, but plan replacement in the next 6–12 months. | Irreversible fraction is growing; track dTMP/dt to schedule the swap. |
| Permeability recovers <80% | Stop spending chemicals on this module; schedule replacement. | Foulant is in the irreversible regime; further chemical exposure ages the polymer without restoring flux. |
| Second consecutive CIP fails to match the first recovery | Replace the module. | Module is at end-of-life — typically 5–8 years for submerged PVDF flat-sheet modules on mixed municipal/industrial influent (Wikipedia, 2026 cites a 5-year service life target). |
| Visible defects: delamination, cracked permeate manifold, broken aeration-box weld | Replace immediately, do not clean. | Mechanical failure, not fouling; CIP cannot fix it. |
Quantify the trade-off so the procurement conversation stops being a debate about chemistry. A single recovery CIP on a 1,000 m² membrane train consumes roughly 200–500 m³ of permeate for rinsing, 20–60 L of NaOCl, and 30–80 kg of citric acid. A single replacement element covering 12.5 m² in the DF series is a known fixed cost. The rule of thumb that survives audit: every 3–4 failed recovery CIPs on the same module equals one element replacement, and the element replacement is the cheaper path once you add labor, downtime, and the risk of polymer damage from repeated chemical exposure. For sites that have not yet standardized on the DF series, the consumables line — RO and UF membrane consumables — is the reference category to size replacement against.
For broader context on MBR economics and the choice between membrane bioreactors and conventional activated sludge, the 2026 MBR vs CAS process comparison walks through the same trade-off at the plant level. For capacity planning on a packaged skid, the packaged MBR sizing guide covers how cleaning intervals scale with hydraulic load.
Frequently Asked Questions
How often should an MBR membrane be chemically cleaned?
Maintenance CIP every 1–4 weeks with 500–1,000 mg/L NaOCl at pH 10–11 is the typical industrial interval. Run a recovery CIP (citric acid followed by 1,000–2,000 mg/L NaOCl, 2–6 hours at 30–35 °C) only when TMP crosses 0.4–0.5 bar, not on a fixed calendar.
What is the right TMP to trigger a recovery CIP on a submerged MBR?
0.4–0.5 bar is the standard trigger for submerged PVDF flat-sheet modules. Do not run sustained operation above 0.6 bar; the cake layer moves into the irreversible regime and the post-CIP recovery percentage drops sharply.
Can you use chlorine dioxide or hydrogen peroxide instead of NaOCl for MBR CIP?
Yes, both work and both are easier on PVDF at higher pH than NaOCl, but they cost 3–8× more per equivalent oxidation dose and require on-site generation for ClO₂. NaOCl remains the default because it is cheap, widely available, and well-characterized against the PVDF compatibility envelope.
How long does a PVDF MBR membrane last before replacement?
5–8 years is the typical service life for submerged PVDF flat-sheet modules on mixed municipal/industrial influent. Replacement is driven less by age than by the failure to recover ≥80% of clean-water permeability after a correctly executed recovery CIP.
Does raising aeration reduce the need for chemical cleaning?
Yes — coarse-bubble air scour beneath the modules is the cheapest cleaning tool in the box. Verify the specific aeration demand per m² of membrane area against the OEM setpoint; a 15% drop in air flow can double the recovery CIP interval even when nothing else changes.