
Why Electrodialysis Energy Use Matters in 2026
Thermal evaporators still anchor most zero-liquid-discharge (ZLD) designs, and they remain the baseline every electrodialysis (ED) proposal is judged against. A mechanical vapor recompression or multi-effect evaporator typically draws 10–25 kWh per kilogram of water removed (Liu et al., 2026); a well-optimized ED or bipolar-membrane electrodialysis (BMED) train on a comparable saline stream runs 1.5–4.5 kWh/kg, roughly an order of magnitude lower. The board-level question is no longer whether ED is cheap enough; it is which design choices lock in the lowest specific energy consumption (SEC) for a given feed.
The 2026 expectation is set by history. The energy required to produce 1 m³ of fresh water from seawater fell from roughly 20 kWh in 1970 to 2.5 kWh by 2010, a 92% reduction in four decades (Al-Amshawee et al., 2020). Any ED retrofit proposed today has to beat that curve, not the legacy numbers still printed in some vendor brochures. Four levers dominate: current density versus the limiting current density (LCD), membrane and stack configuration, spacer and hydraulic design, and hybridization with reverse osmosis (RO), renewable power, or CO₂-capture integration. This article walks through each one with the operating rules, reference data, and procurement language a process engineer can carry into a steering-committee meeting.
How an Electrodialysis Stack Actually Uses Energy
Specific energy consumption (SEC) in ED is reported two ways: kWh per kilogram of target ion removed (e.g., NO₃⁻, Na⁺) and kWh per cubic meter of permeate produced. Both are useful, but they answer different questions. Current efficiency is the share of passed charge that actually moves target ions across the membrane stack, expressed as a percentage; the balance is lost to co-ion transport, water splitting, and parasitic back-diffusion (Campione et al., 2023).
A published ED energy number is rarely a single number. It is the sum of three line items: stack electrical input (the dominant term in well-designed systems), electrode reactions at the end compartments, and pumping plus auxiliary loads. The latter is frequently excluded from academic papers even though it can add 10–30% to the delivered kWh/m³ (Campione et al., 2023). A fair RFQ comparison has to ask bidders to disclose which line items are included.
Every stack has a limiting current density (LCD), the maximum current the membrane-solution interface can sustain before water dissociation, back-diffusion, and fouling accelerate. Push the rectifier above LCD and the stack voltage climbs while useful ion transport plateaus; the gap between the two is wasted energy. Reverse-electrodialysis (RED) studies on synthetic coal-mine brines show a coupled effect: gross power density ranging 2.31–10.75 W/m² and salt removal 3.94–16.13 wt% across 20–40 °C, 1–2 mol/L, and 896–1550 mL/min (Ngobese, 2024). The same coupling applies in forward ED: feed concentration, temperature, and flow rate are not independent knobs. Energy is a hydraulic-and-electrical problem, never just an electrical one.
Operating Levers: Current Density, Voltage and Feed Concentration
Translating the LCD concept into a commissioning rule is the single highest-leverage move an engineer can make. The 2026 BMED optimization study identified 16 V as the optimum applied voltage before parasitic back-diffusion and energy use both rise (Liu et al., 2026). The general rule: size the rectifier for 70–80% of LCD, not for maximum throughput. Operating below LCD sacrifices some kg/day but pays back in current efficiency, membrane life, and lower kWh/kg of recovered product.
Energy savings also come from process integration. Bipolar-membrane ED paired with CO₂ desorption (EDBM) cut energy consumption by 29% compared with operation at 1.5 atm, and the captured CO₂ cost roughly 300 kJ/mol, only about 19% of the energy embedded in downstream methanol synthesis (Campione et al., 2023). That gain is not from electrical tuning alone; it comes from running the stack at the pressure and pH window where the BPM works hardest.
Feed concentration is the third lever. A higher initial salt concentration lowers specific energy for both acid and base production in BMED (Liu et al., 2026), which is why pairing ED with an RO pre-concentrator is an energy strategy, not a separate process. The catch is that kWh/kg and kWh/m³ tell different stories. Single-pass nitrate recovery runs at 1.44 kWh/kg NO₃⁻, but the same chemistry operated as a two-batch scheme climbs to 4.34 kWh/kg because the second pass works on a depleted stream (Campione et al., 2023). Always report the operating mode alongside the number.
| Parameter | Operating window | Effect on SEC | Source |
|---|---|---|---|
| Applied voltage / current density | 70–80% of LCD (≈16 V optimum in cited BMED) | Below this: inefficient mass transfer; above: back-diffusion and water splitting | Liu et al., 2026 |
| Initial feed concentration | Higher Na₂SO₄ lowers BMED SEC for acid/base | Linear decrease in kWh/kg of base produced | Liu et al., 2026 |
| Operating mode (single vs multi-pass) | 1.44 kWh/kg NO₃⁻ (single) → 4.34 kWh/kg (two-batch) | 3× swing on the same chemistry | Campione et al., 2023 |
| Pumping & auxiliaries | 10–30% of delivered kWh/m³ | Often omitted in vendor SEC | Campione et al., 2023 |
| RED coupled variables (T, C, Q) | 2.31–10.75 W/m²; 3.94–16.13 wt% salt removal | Hydraulic and electrical are coupled | Ngobese, 2024 |
Stack Design Choices That Move the kWh/kg Number
Configuration choice can shift specific energy by an order of magnitude on the same feed. A two-compartment BMED stack using a BPM-CEM (bipolar membrane–cation exchange membrane) assembly reaches 1.54–1.9 kWh/kg at 3.4–3.6 mol/L base; comparable three-compartment BPM-AEM-CEM systems in the same review consumed 21.8–43.5 kWh/kg (Campione et al., 2023). The two-compartment cell trades long-term operational stability for minimum energy; the three-compartment cell trades energy for stability. In a battery-recycling sodium-sulfate stream, the two-compartment BPM-CEM consistently won on energy (Liu et al., 2026).
Conventional ED suits bulk salt removal where the target is demineralized water, not recovered acid and base. Electrodialysis reversal (EDR) adds automatic polarity reversal to scour foulants, accepting a 5–10% energy penalty in exchange for stable operation on precipitating feeds like hardness-laden RO concentrate. Selective-ED (SED) and selectrodialysis target monovalent/divalent splits with specialty membranes and serve niche applications such as lithium recovery and nitrate separation. Each option sits in a different point on the energy-versus-application curve.
Counter-intuitively, increasing the number of recovery chambers in a BMED stack raises current efficiency and lowers specific energy (Campione et al., 2023). Buyers who assume "fewer, bigger cells" saves CAPEX are paying for that assumption in kWh/kg for the next decade. Stack height, not stack width, is usually the right optimization knob.
| Configuration | Target ion / product | Typical SEC band | Fouling control | Best fit |
|---|---|---|---|---|
| Conventional ED | Bulk salt removal, desalination | 1.5–4.5 kWh/kg water | EDR reversal or chemical cleaning | Brackish water, RO concentrate polishing |
| EDR (reversal) | Same as ED, harder feeds | Conventional ED + 5–10% reversal overhead | Built-in via polarity reversal | Precipitating feeds, high hardness |
| BMED two-compartment (BPM-CEM) | Acid + base recovery | 1.54–1.9 kWh/kg at 3.4–3.6 mol/L base | Spacer + pre-treatment critical | Na₂SO₄ from battery recycling, salicylic acid waste |
| BMED three-compartment (BPM-AEM-CEM) | Acid + base with high purity | 21.8–43.5 kWh/kg | More robust long-term | Where stability outweighs energy |
| Selective ED / SED | Monovalent vs divalent splits | Application-specific, typically 2–8 kWh/kg | Specialty membrane management | Li recovery, Cl⁻/SO₄²⁻ splits |
Spacers, Hydraulics and Fouling Control
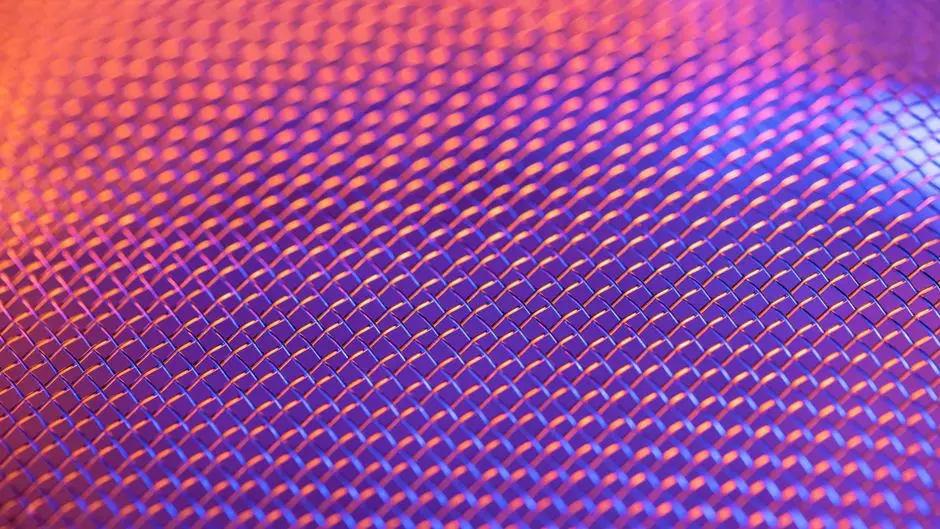
A fouled membrane forces the rectifier to push harder at the same flow, so the cheapest kWh saved is the one a stack never has to spend fighting scale or biofilm. Spacer geometry controls mass transfer at the membrane surface; thinner filaments and triple-layer mesh spacers improve mass-transfer coefficients and reduce fouling compared with conventional woven spacers (Liu et al., 2026). For brine feeds with calcium, sulfate, or organic foulants, this is the difference between a stack that holds its voltage at 16 V and one that drifts to 22 V over a week.
EDR polarity reversal is the workhorse fouling-control strategy. The reversal cycle is typically 15–60 minutes and adds 5–10% to stack kWh; that overhead has to be counted against the energy the alternative (a clean-in-place shutdown, or a higher average voltage) would cost. The right cycle frequency is feed-specific and should be tuned during commissioning, not locked in the PLC on day one.
Upstream, the most overlooked kWh saver is pre-treatment. A HydropureWater DAF pre-treatment unit drops FOG, colloids, and bulk TSS before they reach the membrane stack, and a rotary mechanical bar screen protects the downstream multi-media filter from ragging. Coarse screening first, then DAF, then a multi-media pre-filter sized to the stack's pressure drop is the standard sequence for a brine feed. For background on the broader energy-reduction playbook across biological and membrane unit operations, the anaerobic digester energy reduction strategies guide covers adjacent cost levers a steering committee will also see in the CAPEX table.
Hybrid Trains: RO+ED, ED+Renewables and EDBM
ED rarely wins as a standalone block; it wins as one stage in a train. A 2023 review reported an optimized RO+ED hybrid that delivered 17% lower electrical energy consumption and 8% lower specific energy (thermal + electrical per m³ of desalted water) compared with RO alone, by handing off the high-recovery, high-concentration tail to ED where its SEC-per-kg advantage is largest (Campione et al., 2023). The RO membrane does the cheap bulk desalination; the ED stack polishes and concentrates.
EDBM (bipolar-membrane ED with CO₂ desorption) is the headline 2026 number for the food, mining, and CO₂-utilization sectors: 29% energy reduction versus the 1.5 atm baseline, and a capture-and-regeneration cost around 300 kJ/mol of CO₂, roughly 19% of the energy that downstream methanol synthesis would otherwise consume (Campione et al., 2023). For a plant already sitting on a carbonate-rich alkaline waste, this is a sellable byproduct stream, not an effluent cost.
Renewable-power coupling is the 2026 procurement question that has no single answer. The flexibility of ED, ability to throttle current and accept variable input without crashing membranes (Al-Amshawee et al., 2020), is real, but a stack fed by intermittent solar or wind needs buffer tanks sized to ride through the longest expected power dip, and the EDR reversal cycle has to be rescheduled for those dip windows. Quantifying that storage cost is site-specific and not something a vendor can put in a brochure. The pre-concentrator in front of an ED/BMED stack is most often a HydropureWater industrial RO system sized to the BMED's optimum feed concentration; the feed-concentration lever in the operating section above is the reason that pairing is more than brand alignment. For an application-specific walk-through of RO design in a high-recovery food plant, the RO desalination engineering guide is the right companion read.
2026 Procurement Checklist: Turning kWh/kg Into a Buying Decision
The gap between a published SEC and a delivered one is closed in the RFQ, not the commissioning report. Use this list to make every bidder defend the same number.
- Demand two SEC numbers, not one. Ask for kWh per kg of target ion recovered AND kWh per m³ of permeate, both at a declared feed concentration and recovery rate. If a vendor offers only one, assume the other is worse.
- Require a current-density-versus-LCD operating curve. The bidder should state the rectifier sizing rule (70–80% of LCD) and the operating point at guaranteed SEC. The kWh/m³ must be reproducible from this curve at commissioning.
- Specify stack and membrane configuration in the bid. Conventional ED, EDR, BMED two- or three-compartment, BPM-CEM versus BPM-AEM-CEM, spacer type, EDR reversal frequency, and the membrane supplier. Reference the published SEC bands (1.54–1.9 vs 21.8–43.5 kWh/kg) as the acceptance range.
- Ask for fouling-control evidence. Spacer design statement, pre-treatment specification, and CIP protocol. The cheapest kWh is the one the stack never has to push through a fouled membrane, and the battery electrolyte wastewater cost guide shows how pretreatment choices flow into the OPEX line.
- Require a hybrid-train energy model. For a saline feed below 5 g/L, the deliverable should include an RO+ED SEC comparison, not a standalone ED number. Use the 17% electrical and 8% specific-energy savings from the cited hybrid case as the minimum bar.
- Pin the operating window in the warranty. Voltage ceiling (the 16 V BMED optimum), maximum feed concentration, and maximum turbidity entering the stack should be warranty conditions, not commissioning targets. Energy drift outside the window is the bidder's risk, not the buyer's.
Frequently Asked Questions
What is a realistic specific energy for an electrodialysis system in 2026?
For conventional ED on saline streams, 1.5–4.5 kWh/kg of water removed is a defensible 2026 band. For BMED recovering acid and base, published values span 1.54–43.5 kWh/kg of product, with the two-compartment BPM-CEM configuration sitting at the low end (1.54–1.9 kWh/kg) and older three-compartment systems at the high end (Campione et al., 2023; Liu et al., 2026). Per m³ of permeate, optimized ED/EDR trains on brackish water typically run 0.5–2.5 kWh/m³, versus 10–25 kWh/kg removed for a thermal evaporator (Liu et al., 2026).
How much can current-density control save?
Operating at 70–80% of the limiting current density, the rectifier sizing rule used in the cited BMED study, holds the stack at its 16 V optimum and avoids the parasitic back-diffusion and water splitting that push voltage and energy use higher above LCD (Liu et al., 2026). In well-controlled retrofits this lever alone returns 10–20% of baseline kWh/kg without hardware changes.
Is BMED more energy-efficient than conventional ED?
It depends on the product. For salt removal alone, conventional ED and EDR sit at 1.5–4.5 kWh/kg of water, far below the BMED 21.8–43.5 kWh/kg band seen in three-compartment cells. For acid-and-base recovery from a salt, a two-compartment BPM-CEM BMED reaches 1.54–1.9 kWh/kg of base, lower than most reported three-compartment systems (Campione et al., 2023; Liu et al., 2026). Configuration, not the BMED label, drives the number.
When does RO+ED beat RO alone?
When the RO system is asked to push recovery above roughly 70–75% on a scaling-prone feed, the RO energy curve steepens and concentrate disposal becomes the dominant cost. An RO+ED hybrid cited in the 2023 review hit 17% lower electrical energy and 8% lower specific energy (thermal + electrical) per m³ of desalted water compared with RO alone, by handing the high-recovery tail to ED (Campione et al., 2023). On lithium brines, battery-recycling sulfate streams, and food-industry salines, this is the default case for new builds in 2026.
Can electrodialysis run on renewable power?
Yes, and ED's ability to throttle current without crashing membranes is a real advantage over RO in variable-power operation (Al-Amshawee et al., 2020). The cost is buffer-tank volume to ride through the longest expected power dip, plus rescheduling of EDR reversal cycles to avoid cycling during low-input windows. Site-specific solar or wind profiles and tariff structures drive the payback more than the membrane stack itself; published kWh savings for the renewable case are not yet standardized, so a feasibility study is still required for each site.