Why Palmetto Chemicals Plants Are Re-Evaluating Activated Sludge in 2026
For a Palmetto, Florida chemicals plant in 2026, MBR beats conventional activated sludge (CAS) on effluent quality, footprint, and nutrient removal — full-scale MBRs deliver ammonia-N of 0.10–0.72 mg/L, total P of 0.12–0.55 mg/L, and turbidity near 0.01–1.31 NTU — but CAS still wins on lowest capex for very large flows. The right choice depends on influent toxicity, FDEP Chapter 62 limits, and whether you are retrofitting or building new.
Two regulatory pressure points are forcing the re-evaluation. First, FDEP Chapter 62-625 (industrial wastewater design and operation) and Chapter 62-660 (pretreatment and residuals) push effluent ammonia, total nitrogen, and in many permits TDS limits lower than the CAS basins installed in the 1990s and early 2000s were sized for — particularly at sites discharging to the Manatee River watershed or to Tampa Bay tributaries, where the Manatee County industrial pretreatment program has tightened local limits to match downstream TMDL targets. Second, the chemistry inside these plants has changed: resins, specialty additives, agrochemical intermediates, and solvent washes routinely deliver pH 2–12 swings, COD spikes of 500–5,000 mg/L, and inhibitory organics (amines, aromatics, glycols) that crash nitrifiers and trigger filamentous bulking in a CAS clarifier. When the sludge blanket pins and TSS blows through the effluent limit, the conversation turns to membranes.
Land cost inside the Palmetto industrial corridor makes the footprint argument real. A compact integrated submerged MBR system can hit a 60% smaller footprint than an equivalent CAS train with tertiary filtration (HydropureWater verified product catalog, 2026), which matters when a 0.5-acre setback is the difference between a permit and a denial. In 2026, most Palmetto chemicals sites are retrofitting existing aeration basins rather than building greenfield — so the engineering matrix has to handle both paths, and the MBR vs conventional activated sludge for chemicals wastewater in Palmetto, United States question is rarely a clean "either/or."
How Conventional Activated Sludge Treats Chemicals Wastewater
A CAS train at a Florida chemicals plant is a biological workhorse, but it is also a chain of unit operations that can be knocked sideways by a process upset. The typical configuration is equalization → primary clarification (or DAF for oily streams) → aeration basin → secondary clarifier → sand or disc filtration → chlorination or UV. The aeration basin is the heart, and the EPA Nutrient Control Design Manual (EPA/600/R-09/012, January 2009) documents the process variants most commonly in service: Modified Ludzack-Ettinger (MLE), 4-stage Bardenpho, A2/O, UCT/MUCT, Johannesburg (JHB), OWASA, oxidation ditches, and sequencing batch reactors (SBR). At small Palmetto sites, SBR and oxidation ditches dominate because they combine BNR with a smaller site footprint than a plug-flow train.
Operating envelopes are well established in EPA CAS literature, not invented here. A well-tuned CAS basin runs MLSS 2,000–4,000 mg/L, SRT 5–20 days, HRT 6–12 hours, and F/M 0.2–0.5 lb BOD/lb MLSS-day, producing effluent TSS 10–30 mg/L and BOD 20–30 mg/L at a properly managed plant. SRT extension beyond ~10 days is what allows nitrification; beyond ~15 days in a configured basin it allows partial denitrification and some biological phosphorus uptake in A2/O or Bardenpho layouts.
Where CAS hurts in a chemicals plant is exactly where MBR helps. Filamentous bulking from intermittent solvent and amine loads drags the SVI above 200 mL/g and pushes sludge over the weir. pH excursions below 6 or above 9 stall nitrifiers, and because the clarifier is a passive settler it cannot retain biomass when the bugs go dormant — they wash out, SRT collapses, and recovery takes days. In a plant running a 7-day SRT to stay in nitrification, a 48-hour toxic upset can wipe out a month of stable operation. That recovery cost — not the capex — is usually what brings CAS retrofit MBR into the budget meeting.
How an MBR Treats the Same Stream
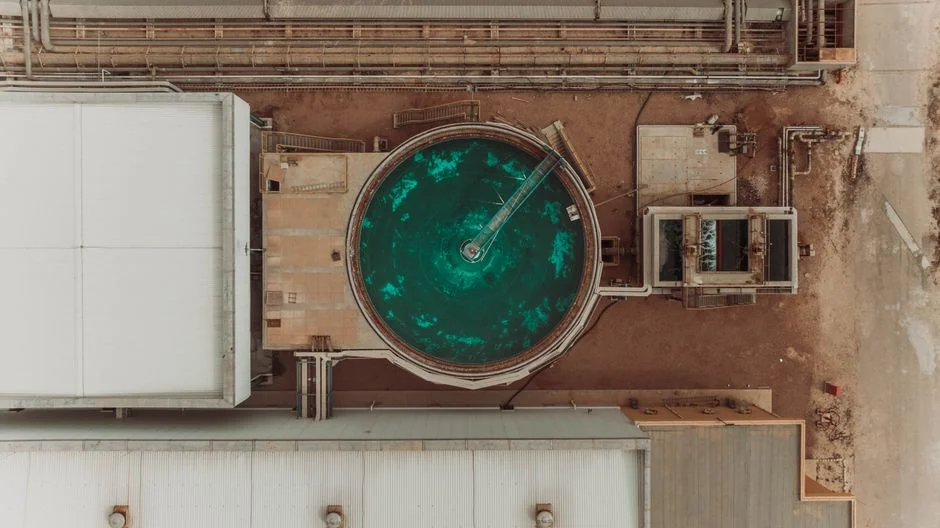
An MBR is not a different biology; it is the same suspended-growth activated sludge with the secondary clarifier and most sand filtration replaced by a microfiltration or ultrafiltration membrane module. Per the EPA MBR Fact Sheet, MBR membranes for this duty are typically 0.1–1 μm PVDF hollow fiber or flat sheet, immersed directly in the aeration basin or in a separate membrane tank fed by recirculated mixed liquor. The permeate is the plant's final clarified effluent; the retained biomass is returned to the bioreactor so MLSS can run 8,000–12,000 mg/L, SRT 20–60 days, and HRT 3–6 hours — a much smaller basin volume than CAS for the same organic loading.
Full-scale numbers from the EPA MBR Fact Sheet set the performance bar that drives the retrofit decision. At the Calls Creek (GA) facility, BOD and TSS sit near detection limits, ammonia-N averages 0.21 mg/L (max-month 0.72, min-month 0.10), total P 0.28 mg/L average (max 0.55, min 0.12), and turbidity 0.30 NTU average (max 1.31, min 0.01). That is the effluent quality a Palmetto chemicals plant is being asked to hit under tightening FDEP limits — consistently, with a clarifier that has no moving parts and no sludge blanket to lose.
For a chemicals plant, however, MBR is not plug-and-play. Solvent droplets, surfactants, and undissolved resins foul PVDF membranes fast, and there is no clarifier upstream to catch the slug. That is why the EPA MBR Fact Sheet requires 1–3 mm fine screens immediately before the membranes (1–2 mm for hollow fiber, 2–3 mm for flat plate, per Wallis-Lage et al. 2006) and why equalization plus oil/solvent removal are not optional upstream of a Palmetto MBR. A well-designed integrated submerged MBR system bundles those pretreatment screens and anoxic/aerobic zones, but the influent character still has to be matched to the biology.
MBR vs CAS for Chemicals Wastewater: Engineering Comparison Matrix
This is the matrix to screenshot and forward to the plant manager. Every row answers a question a CAPEX committee will actually ask. The MBR column is anchored to EPA MBR Fact Sheet numbers; the CAS column is anchored to EPA Nutrient Control Design Manual configurations and standard operating envelopes.
| Parameter | CAS (MLE / Bardenpho / A2/O / SBR) | MBR (submerged PVDF) | 2026 Palmetto retrofit note |
|---|---|---|---|
| Influent tolerance (pH / COD swings) | Moderate; pH 6.5–8.5 preferred; bulks on solvent spikes | Higher (decoupled settling); still needs equalization | Add EQ basin before either train on a chemicals site |
| MLSS (mg/L) | 2,000–4,000 | 8,000–12,000 | Existing CAS basin becomes MBR biology tank |
| SRT (days) | 5–20 | 20–60 | Long SRT protects nitrifiers from solvent spikes |
| HRT (hours) | 6–12 | 3–6 | Halves basin volume vs CAS at same loading |
| Effluent BOD (mg/L) | 20–30 | <5 (near detection) | MBR meets reuse limits without tertiary |
| Effluent TSS (mg/L) | 10–30 | <1 | MBR eliminates clarifier failure mode |
| Effluent ammonia-N (mg/L) | 1–5 (depends on SRT, T) | 0.10–0.72 | MBR reliably hits FDEP Chapter 62-625 ammonia |
| Effluent total P (mg/L) | 0.5–2.0 (chem P needed) | 0.12–0.55 | MBR P often meets limits without tertiary chemical dose |
| Effluent turbidity (NTU) | 2–10 (after sand filter) | 0.01–1.31 | MBR permeate ready for UV or reuse |
| Footprint | 100% baseline | ~40% (60% reduction) | Critical at Palmetto sites with tight setbacks |
| Energy use | Lower (blower + mixing only) | Higher (membrane air scour adds ~30–50%) | Audit blower capacity on any retrofit |
| Chemical use | Polymer for sludge; chem P if needed | NaOCl + citric acid cleans; less polymer | Per EPA MBR Fact Sheet, cleaning protocol is fixed |
| Sludge yield | Baseline | Lower at long SRT | Smaller dewatering unit downstream |
| Reuse suitability | Marginal; needs tertiary | Direct to cooling tower / irrigation | Offset capex via reduced potable water |
| Capex per m³/day (qualitative) | Lower at very large flows | Higher at small/medium flows | MBR capex premium shrinks above 500 m³/day |
| Opex per m³ (qualitative) | Lower energy, higher sludge | Higher energy + membrane replacement | Membranes every 7–10 years is the big line item |
| Membrane replacement | N/A | 7–10 yr (Zenon offers 10-yr) | Spec the guarantee length in 2026 procurement |
| FDEP Chapter 62 compliance posture | Tight; needs polishing step | Comfortable; meets reuse class | Manatee County pretreatment coordinator will recognize MBR |
For a Palmetto retrofit, the most common path is a hybrid: keep the existing aeration basin as the biology tank, add an anoxic zone if denitrification is required, drop in a DF series flat-sheet MBR membrane module cassette train, and add a 1–2 mm fine screen upstream. That preserves most of the original capex base while gaining MBR effluent quality.
Retrofit or Greenfield: How Palmetto Plants Are Choosing in 2026
The decision branch for a 2026 Palmetto chemicals site is short enough to fit on one page. If the plant already has an aeration basin with at least 6 hours HRT at average flow and a healthy RAS/waste-activated-sludge system, the lowest-risk path is to retrofit to MBR by adding a membrane tank, fine screens, and a chemical cleaning skid. If the existing basin is undersized, corroded, or pinned by chronic bulking, weigh CAS+tertiary (a new SBR plus sand filters plus UV) against a greenfield MBR sized to the same design flow.
The footprint argument usually tips the balance. At sites smaller than roughly 2,000 m³/day — which describes most Palmetto specialty chemicals and resin plants — a 60% smaller footprint (HydropureWater verified product catalog, 2026) means MBR almost always wins on land even when CAS wins on first-cost. The chemicals-specific retrofit gotchas are predictable: existing positive-displacement or multistage blowers are often undersized for MBR's higher oxygen demand at 8,000–12,000 mg/L MLSS, and equalization must be added if peak flows exceed 1.5–2× average (per EPA MBR Fact Sheet, Wallis-Lage et al. 2006). Both are line items that belong in the feasibility study, not as change orders after installation.
One more concept from the EPA MBR Fact Sheet that belongs in any 2026 procurement spec: the "N+1" membrane train. Install one more cassette than the design flow strictly needs so a unit can be offline for cleaning or repair without forcing a permit violation. For a chemicals plant with intermittent batch discharges, that redundancy is also the cheapest insurance against a solvent slug that takes a train out of service.
Cost, Compliance, and Reuse: The 2026 Palmetto View
The 2026 cost story is two-sided. Capex per m³/day for MBR is typically higher than CAS at the same flow, but capex per kg COD removed is often lower because the higher MLSS and shorter HRT push more loading through a smaller basin. Opex runs higher for MBR due to membrane air-scour energy and the cleaning chemical regime (sodium hypochlorite plus citric acid per the EPA MBR Fact Sheet). The single biggest opex line item is membrane replacement on a 7–10 year cycle; Zenon's published 10-year guarantee (per the EPA MBR Fact Sheet) is the benchmark, and most flat-sheet and hollow-fiber vendors will negotiate 3–5 years unless the influent screening spec is tight. Spec both screen size and guarantee length in the 2026 RFQ — the two are linked, per Wallis-Lage et al. 2006.
| Cost / compliance driver | CAS train | MBR train | 2026 Palmetto implication |
|---|---|---|---|
| Capex per m³/day | Lower at large flows | Higher up front, lower per kg COD removed | MBR premium shrinks above ~500 m³/day |
| Opex energy | Lower (no membrane scour) | +30–50% for air scour | Blower audit mandatory on retrofit |
| Membrane replacement | N/A | Every 7–10 years; 3–5 yr on tough feeds | Largest opex line; spec guarantee length |
| Cleaning chemicals | Polymer, maybe chem-P | NaOCl + citric acid (EPA MBR Fact Sheet) | Budget ~5–10% of membrane cost/yr |
| FDEP Chapter 62-625 reuse | Marginal without tertiary | Comfortable; meets slow-sand class | Manatee County pretreatment sign-off faster |
| On-site reuse offset | Limited | Cooling tower makeup, irrigation | Reduces potable water purchase at Palmetto |
| TDS / total nitrogen trend | Likely tightens with new permit | MBR + RO polish handles it | Plan for RO polishing if reuse sale is the goal |
On the compliance side, MBR effluent quality typically meets FDEP Chapter 62-625 reuse and surface-discharge limits without a tertiary sand filter, and supports on-site reuse for cooling tower makeup or landscape irrigation at a Manatee County site. That reuse offset — reduced potable water purchase plus potential resale to a nearby industrial user — is the financial argument that turns an MBR capex conversation into an MBR business case. For a deeper look at 2026 cost-per-m³ ranges, the MBR cost-per-m³ 2026 guide walks through the line items, and the how an MBR works process guide covers the hydraulics for a peer review. For sites chasing biological COD removal ahead of the MBR, the fine chemical wastewater COD removal guide is the matching upstream read.
Frequently Asked Questions
For a Palmetto chemicals plant, is MBR better than conventional activated sludge?
For most Palmetto chemicals sites in 2026, yes — MBR delivers ammonia-N of 0.10–0.72 mg/L, total P of 0.12–0.55 mg/L, and turbidity of 0.01–1.31 NTU (EPA MBR Fact Sheet), with roughly 60% less footprint (HydropureWater verified product catalog, 2026). CAS still wins on lowest capex at very large flows where the footprint is not constrained.
Can an MBR retrofit into an existing CAS basin?
Yes, and it is the most common 2026 Palmetto project path. The existing aeration basin becomes the MBR biology tank, a membrane tank and 1–2 mm fine screens are added, and the N+1 cassette concept (EPA MBR Fact Sheet) keeps a train online during cleaning. Audit blower capacity — MBR's higher MLSS drives more oxygen demand than most 1990s blowers were sized for.
What FDEP limits drive the MBR choice in 2026?
FDEP Chapter 62-625 (industrial wastewater) and Chapter 62-660 (pretreatment), as enforced through Manatee County industrial pretreatment, are pushing effluent ammonia, total nitrogen, and TDS limits lower. MBR's documented ammonia-N of 0.10–0.72 mg/L and very low TSS meet those trajectories without a separate tertiary polishing step.
How often do MBR membranes need replacement at a chemicals plant?
Every 7–10 years with proper screening and a sodium-hypochlorite-plus-citric-acid cleaning protocol (per the EPA MBR Fact Sheet, Wallis-Lage et al. 2006). Zenon publishes a 10-year guarantee; most vendors offer 3–5 years. Uncontrolled solvent loads shorten membrane life significantly — equalization and oil/solvent removal upstream are not optional.
Does MBR handle solvent or pH spikes from chemicals production?
Better than CAS, because the membrane retains biomass independent of settling, so the system can hold 8,000–12,000 mg/L MLSS and a 20–60 day SRT through a pH or solvent upset that would wash a clarifier. Upstream equalization plus oil/solvent removal are still required — no MBR magic-bullet replaces influent control on a chemicals plant.