Why Wastewater Treatment Plants Are Now an Energy-Audit Priority
Wastewater treatment consumed approximately 4% of global electricity in 2014, equivalent to 952.54 TWh, according to the IEA as cited in an MDPI 2025 case study. That share is projected to rise 60% by 2040 as treatment infrastructure expands in major urban centers, driven by population growth and tighter effluent quality standards. For a 100,000 m³/day municipal plant running near median performance, electricity is already the second-largest line item after labor — and often the largest once biosolids handling is included.
The regulatory pressure has caught up with the physics. In 2023, the European Commission ruled that production units under the Intensive Energy Consumption Management System (SGCIE), which explicitly covers WWTPs, must reduce final energy consumption by at least 11.7% by 2030 against the previous decade's projections. ISO 50001:2018 with its Plan-Do-Check-Act (PDCA) cycle is the framework regulators, utilities, and ESG reporting bodies now reference when asking for evidence of structured energy management. A documented audit under that framework is no longer optional engineering hygiene — it is the file a board, a regulator, or a lender will eventually ask to see.
The Three ASHRAE Audit Levels Explained for WWTPs
ASHRAE defines three audit depths, and picking the right one saves both money and credibility when the report lands on a finance director's desk. Level 1 is a walk-through audit that takes 2-6 hours on site at a small facility (per US EPA guidance) and reliably turns up no- and low-cost O&M changes plus quick wins in lighting, HVAC, and pumping. Level 2 is a detailed energy analysis that adds equipment field tests, system-level energy profiling, and payback estimates for each recommended measure — the workhorse level for most mid-size plants. Level 3 is investment-grade, used when major capital projects need defending to a board or a lender.
Cost benchmarks from the US EPA put detailed process audits at $5,000 to $25,000+ depending on plant size and complexity, while walk-through audits are often free through local electric utility programs. Many utilities will match up to 50% of audit cost. Before commissioning anything, benchmark the plant first using EPA ENERGY STAR Portfolio Manager or the DOE Industrial Assessment Centers (IAC) tool — both are free, and the IAC route is no-cost for facilities whose annual energy bill exceeds $100,000.
| ASHRAE Level | Typical Scope | Site Time at a 50,000 m³/day Plant | Indicative Cost (USD) | Best Fit For |
|---|---|---|---|---|
| Level 1 — Walk-through | Visual inspection, utility bill review, O&M quick wins | 4-8 hours | Free to ~$2,000 (often utility-funded) | Small utilities, plants with no prior audit, ESG disclosure prep |
| Level 2 — Detailed Energy Analysis | Sub-metering plan, equipment field tests, system energy profiles, ECM payback estimates | 3-7 days on site | $5,000-$25,000+ | Mid-size and large plants preparing a capex business case |
| Level 3 — Investment-Grade | Hourly data logging, calibrated modeling, M&V protocol | 2-6 weeks | $25,000-$100,000+ | Major retrofits, bond-funded projects, ISO 50001 certification |
The ISO 50001:2018 PDCA Methodology Step by Step
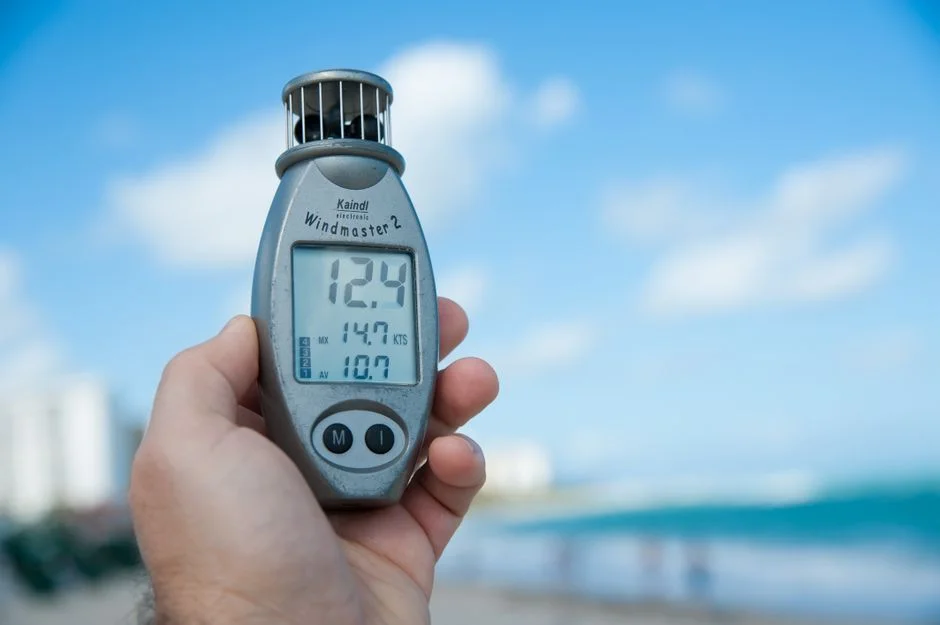
ISO 50001:2018 structures the audit as a continuous Plan-Do-Check-Act cycle rather than a one-off report, and that distinction is what regulators and ESG auditors look for. Under PLAN, collect at least 12 months of utility bills, sub-meter data, and influent/effluent quality records; define an energy baseline and the energy performance indicators (EnPIs) you will track — typically kWh/m³ treated and kWh/kg BOD removed. The DO phase implements monitoring, trains operators, and documents significant energy uses (SEUs): aeration, pumping, sludge handling, disinfection, and HVAC/lighting.
CHECK is where the savings surface. Analyze deviations from the baseline and run targeted 24-hour monitoring on suspected weak spots. In the MDPI 2025 northern Portugal case study, a 24-hour monitoring exercise on the lifting pumps uncovered a mechanical anomaly that translated into a 50% energy reduction opportunity on a 4-year payback. ACT closes the loop: prioritize corrective actions, verify results against the EnPIs, and feed verified savings back into the next planning cycle. The same case study records a 7.5% reduction in biological-stage energy from a zero-capital oxygen set-point adjustment — a textbook ACT-phase outcome that cost nothing and required no procurement.
- PLAN: Gather 12 months of utility and sub-meter data; set energy baseline; define EnPIs (kWh/m³, kWh/kg BOD).
- DO: Deploy monitoring, train operators, document SEUs and operational changes.
- CHECK: Compare actual vs. baseline, run 24-hour studies on suspect equipment, quantify deviations.
- ACT: Prioritize corrective measures, verify savings, update the EnPIs, restart the cycle.
Stage-by-Stage Energy Breakdown: Where the kWh Actually Go
Aeration in the biological treatment stage is the dominant line item in every published WWTP audit, typically 40-75% of total plant electrical consumption (MDPI 2025, citing multiple references). At the northern Portugal case-study plant, the biological stage alone was responsible for 70% of total electrical energy consumption. Pumping in preliminary and primary treatment — screening, grit removal, and primary sedimentation — accounts for 10-15%. Disinfection (UV, chlorination, ozone) typically draws 10-20%. Auxiliary systems such as lighting, HVAC, and secondary pumping sit at 5-10%. Sludge treatment is variable but measurable: the case-study plant's sludge stage consumed roughly 250 MWh, or 3.1% of facility load.
Sub-meter building stages (administrative, labs, workshops) separately from process energy. Blending them distorts the process-energy KPI and hides the very losses an audit is meant to find. A rotary mechanical bar screen at the headworks is a small but real part of this picture — keeping screenings out of downstream pump volutes protects pump specific energy and prevents the gradual efficiency drift that audits often flag but cannot easily explain.
| Process Stage | Share of Plant Electrical Load (Benchmark Range) | Case-Study Value (Northern Portugal) | Primary Energy Consumers |
|---|---|---|---|
| Biological treatment (aeration) | 40-75% | ~70% | Blowers, diffusers, mixed-liquor recirculation pumps |
| Preliminary & primary treatment (pumping) | 10-15% | Within range | Lifting pumps, grit removal, primary sludge pumps |
| Disinfection | 10-20% | Within range | UV lamps, chlorinators, ozone generators |
| Auxiliary systems (HVAC, lighting, secondary pumping) | 5-10% | Within range | Building services, control rooms, workshop |
| Sludge treatment | Variable (~3-10%) | ~3.1% (250 MWh) | Thickeners, digesters, dewatering, polymer dosing |
| Building stages (admin, labs) | Sub-meter separately | Sub-meter separately | Lighting, HVAC, plug loads |
Key Performance Indicators and Benchmark Values
Three KPIs cover most benchmarking conversations. The hydraulic KPI, kWh per m³ of wastewater treated, is the cleanest number to publish but is only meaningful for plants with stable influent quality. Pollutant-load KPIs — kWh per kg BOD removed, kWh per kg COD removed, and kWh per kg N removed — are the better comparators for industrial and variable-strength plants. Aeration efficiency, expressed as kg O₂ transferred per kWh, is the diagnostic KPI: the case study measured 1.69 kg O₂/kWh in basin 1 and 0.65 kg O₂/kWh in basin 2, and the second number signals urgent diffuser fouling, blower wear, or both.
Fine-bubble diffusion systems deliver 10-20% aeration energy savings versus coarse-bubble at the same oxygen transfer rate (MDPI 2025). Blower modernization is the larger lever: documented gains include 130-135% specific energy improvement, 53-65% power reduction, and 6-36% flow increase at the same duty point. A MBR membrane bioreactor system is a relevant comparison point here — see the recent MBR vs conventional activated sludge comparison for energy trade-offs at industrial loads.
| KPI | Formula | Typical Range | Watch Threshold | Comment |
|---|---|---|---|---|
| Hydraulic energy intensity | kWh / m³ treated | 0.20-0.60 (municipal) | > 0.50 municipal | Stable influent only |
| Pollutant-load intensity (BOD) | kWh / kg BOD removed | 0.8-2.0 | > 1.5 | Best for variable-strength plants |
| Nitrogen-removal intensity | kWh / kg N removed | 5-15 (with biological N) | > 12 | Drives blower load directly |
| Aeration efficiency (OTE/SOTE) | kg O₂ / kWh | 1.5-2.5 (clean fine-bubble) | < 1.0 | < 1.0 = inspect diffusers and blowers |
Top Retrofit Opportunities Uncovered by Audits
The MDPI 2025 case study turns audit findings directly into a defensible business case. A fine-bubble diffuser replacement cost €32,759, saves €58,810 per year, and reduces electrical consumption by 551,678 kWh/year. Blower replacement with high-efficiency units delivers 130-135% efficiency gain and 53-65% power reduction at the same duty point. Lifting-pump optimization and repair on the case-study plant required €53,728 in capex, hit a 50% energy reduction, and paid back in four years. An oxygen set-point tuning in the biological stage delivered 7.5% reduction with zero capital cost — the single highest-IRR measure in the report.
Outside the case study, two further measures recur in audits. LED lighting retrofits in non-process buildings cut lighting energy by 62% (Fermilab MC-1 DOE study, 2019 baseline). Variable-frequency drives on constant-volume pumps typically return 20-40% pumping energy savings and apply to any plant with oversized or throttled pumps. Headworks upgrades also belong on this list: an inefficient dissolved air flotation system or a poorly screened influent quietly raises pumping-stage energy use, and UV sterilizer retrofits are common low-disruption wins on the disinfection line.
Who Should Conduct the Audit
No industry-specific certification exists for water-sector energy auditors, so references matter more than credentials. Trade associations such as ASHRAE and the Association of Energy Engineers (AEE) offer auditor credentials, but the deciding question is documented experience at water and wastewater treatment facilities. Many electric and gas utilities offer audits through preselected contractors and will match up to 50% of the cost — verify scope before signing, because utility-led audits tend to focus on equipment rebates and short-payback measures. Specialist water-sector auditors are more likely to surface no-capital-cost process changes and chemical-use reductions that a generalist audit will miss. For facilities above $100,000/year in energy costs, US DOE Industrial Assessment Centers provide no-cost detailed process audits. Avoid the common procurement mistake of awarding on price alone — a $5,000 audit that misses 50% of pump-stage savings is the more expensive contract. When you move from audit to implementation, structured performance-based wastewater O&M contracts are the natural vehicle to guarantee the verified savings, and pump cavitation troubleshooting frequently surfaces during the audit's 24-hour monitoring step.
Frequently Asked Questions
How much does an energy audit for a wastewater treatment plant cost?
According to the US EPA, detailed process audits at WWTPs typically run $5,000 to $25,000+ depending on plant size and complexity, while walk-through audits are often free through local electric utility programs. Many utilities will match up to 50% of the audit fee, and the US DOE Industrial Assessment Centers provide no-cost detailed audits for facilities with annual energy costs above $100,000.
Is ISO 50001:2018 required for a wastewater treatment plant energy audit?
ISO 50001:2018 is not universally mandated, but it is the dominant framework referenced in current regulatory and academic literature and is the required methodology for WWTPs operating under the European SGCIE regime. Its Plan-Do-Check-Act structure is what regulators, ESG auditors, and lenders now expect when reviewing an energy management file.
What is the single biggest energy-saving opportunity in a WWTP?
Aeration in the biological treatment stage, which represents 40-75% of total plant electrical load (MDPI 2025). The highest-ROI actions identified in published audits are oxygen set-point tuning (7.5% reduction, zero capex) and fine-bubble diffuser replacement (10-20% aeration energy savings, typical payback under 12 months at energy-cost levels seen in the case study).
What is the difference between ASHRAE Level 1, 2, and 3 energy audits?
ASHRAE Level 1 is a walk-through audit (2-6 hours at a small facility) that identifies O&M quick wins and basic lighting or pump upgrades. Level 2 is a detailed energy analysis with equipment field tests, system-level energy profiling, and payback estimates for each measure. Level 3 is investment-grade work used to defend major capital projects and typically involves hourly data logging and calibrated energy modeling.